- 真实世界 205 例队列中,CrossNN 在 WHO CNS5 类型层级准确率 88.8%,与海德堡分类器非劣效。
- 双分类器并行可使具有临床信息价值且正确的分类增加约 10%;前瞻 41 例验证通过组准确率 100%。
- 对照组织误判多见于坏死或低肿瘤纯度;联合使用有助于提高常规诊断信心。
1 引言
中枢神经系统(CNS)肿瘤的准确分类对患者的最佳管理至关重要。过去主要依据组织学,如今分子参数的作用日益增加。2021 年 WHO CNS 肿瘤分类第 5 版引入 DNA 甲基化谱进行分子分类,推动了该领域的重要进展[1,2]。
DNA 甲基化是一种在细胞分裂过程中保留的稳定表观遗传修饰,参与组织特异性基因调控[3],因而具有高度细胞类型特异性。肿瘤细胞通常表现为全局低甲基化,同时抑癌基因启动子局灶高甲基化,并保留起源细胞信息[4]。这种特征既可区分肿瘤与非肿瘤细胞,也可用于 CNS 肿瘤分子分类。甲基化特征在 FFPE 样本中仍可保留,不受样本处理或储存条件影响,适用于常规诊断[5]。
基于上述原理,已有多种机器学习分类器依据全基因组甲基化谱分类 CNS 肿瘤[6–9]。应用最广的是海德堡 CNS 肿瘤甲基化分类器,它是当前分子分类的重要组成部分。本文所用版本基于 Illumina Human Methylation 930k EPIC v2 BeadChip。该随机森林算法以 7,495 份芯片甲基化谱训练,最新 v12.8 可区分最多 184 个 CNS 亚类,亚类准确率 95%[10]。每份样本得到预测类别及校准分数,反映与训练库参考谱的相似程度。Sill 等将 ≥0.9 定义为可信;Capper 等认为 0.3–0.9 仅具提示性,必须与临床病理紧密结合[11];<0.3 不提供有效信息。EpignostiX 报告还包括拷贝数谱和 MGMT 启动子甲基化状态。低覆盖全基因组纳米孔测序等替代方法更快、更经济,已有研究显示其分类性能与芯片数据相当[8]。
新近推出的 CrossNN 可处理多平台产生的甲基化谱[7]。它采用可解释的神经网络,适应可变且稀疏的输入,以海德堡 v11b4 的 2,801 份样本、82 种肿瘤参考数据训练[6]。在甲基化类别家族层级,总准确率为 95.6%,从靶向测序的 89.5% 到 EPICv2 的 97%。为实现跨平台兼容,输入先二值化:芯片 β 值 >0.6 编码为 1,≤0.6 为 −1,缺失 CpG 为 0。分类器输出预测列表及相似性置信分数。Yuan 等设定芯片数据阈值 0.4、测序数据阈值 0.2;此前尚无全基因组甲基化芯片数据上的独立外部验证。
本研究在真实世界 CNS 肿瘤队列中评价 CrossNN,并与海德堡 v12.8 比较。结果显示其性能不劣于海德堡,支持作为替代诊断方法;同时使用两种分类器可提高诊断准确性。
2 材料与方法
2.1 样本选择
比利时安特卫普大学医院(UZA)自 2022 年将 CNS 肿瘤甲基化检测纳入常规诊断。本研究纳入 2024 年 8 月至 2026 年 6 月连续检测的肿瘤样本。回顾性样本使用经 UZA 伦理委员会批准(项目 7381;EDGE 004111)。两位资深神经病理医生 M.A.、A.S. 评估组织学诊断及肿瘤细胞含量,后者为 10%–95%。肿瘤类型见表 S1。
2.2 DNA 提取及甲基化谱
采用 QIAamp DNA Mini QIAcube Kit(Qiagen,德国 Hilden)按说明书提取 FFPE 肿瘤 DNA。Qubit dsDNA BR 试剂盒(Thermo Fisher Scientific)定量后,取 40–250 ng DNA,以 EpiTect Fast Bisulfite Conversion Kits(Qiagen)进行亚硫酸氢盐转化,再用 Infinium HD FFPE DNA Restore Kit(Illumina,美国 San Diego)修复。使用 Illumina Infinium MethylationEPICv2 BeadChip 和 iScan 获取全基因组甲基化谱,按厂商方案并针对 FFPE 调整。所有样本均经过厂商规定的标准质控;未通过质控或无明确诊断者排除。全部流程符合 UZA 经 ISO 15189 认可的常规诊断程序。
2.3 海德堡分类器预测
将配对的芯片原始强度文件通过 epignostix.com 提交至 v12.8,获取甲基化类别及类别家族预测。每例输出预测的甲基化家族或超家族,适用时给出类别或亚类,以及 0.1–0.99 的校准分数。超家族分数 <0.3 不予报告。
2.4 CrossNN 预测
在 R 4.4.1 中使用 Bioconductor minfi 1.52.1 处理原始强度文件,以 preprocessIllumina 生成 β 值,按 Yuan 等的方法二值化[7,12]。所得矩阵在本地用 CrossNN 脑肿瘤模型(2024 年 1 月 23 日可用版本,gitlab.com/euskirchen-lab/crossNN)处理。每份样本得到甲基化类别或家族预测列表及接近 0 至 0.99 的分数,反映其与训练参考谱的相似性。
2.5 数据分析
所有分析以两位神经病理医生按 WHO CNS5(2021)作出的组织学—分子整合诊断作为真实肿瘤类型。诊断时已知海德堡输出,因此不能排除偏向海德堡的参考标准偏倚。为此,对 CrossNN 错误且与海德堡不同的病例作事后复核,重新整合组织学、分子资料,并以 CrossNN 预测代替海德堡预测。15 例复核病例的最终诊断均未改变(表 S2)。
结果均在 WHO CNS5 肿瘤类型层级比较,因为多数亚类目前无直接临床意义;但保留 IDH 突变型星形细胞瘤低级别与高级别的区分。SHH 激活、TP53 突变型和野生型髓母细胞瘤合并为 SHH 激活型,因为两种分类器均不能区分这两个亚型。
输出分为正确、较高层级或错误。与整合诊断的 WHO 类型一致,或在正确类型之内给出更细亚类,均算正确。海德堡不能达到 WHO 类型层级但超家族正确时,算较高层级,如真实诊断为 IDH 野生型胶质母细胞瘤,而预测为成人型弥漫性胶质瘤。其余算错误。
对 CrossNN 参考库没有的类型,预先将某些生物学和临床相关的输出定义为较高层级,而非错误,以免惩罚因参考库限制而不能细分、但有生物学意义的预测。儿童型弥漫性高级别胶质瘤、H3/IDH 野生型(HGG, PAED)若被预测为 IDH 野生型胶质母细胞瘤,算较高层级,因为两者均为 H3/IDH 野生型弥漫高级别胶质瘤,治疗及预后有重叠。年轻人多形性低级别神经上皮肿瘤(PLNTY)若被判为节细胞胶质瘤,也算较高层级,因为其甲基化特征有重叠。CrossNN 不能区分 MYCN 扩增型脊髓室管膜瘤,因此其脊髓室管膜瘤预测也列为较高层级。
海德堡可在多层级预测。为直接比较,依预定映射规则统一至 WHO CNS5 类型(表 S3),以该层级最高分作为最终输出。<0.3 无有效信息;≥0.9 可信;0.3 至 <0.9 为不可信[11]。
CrossNN 不输出层级预测,主要分析取最高分预测;与海德堡比较时,使用排名前三的输出映射到 WHO 类型。若多个输出属于同一 WHO 类型,则累加分数,反映分配给该类型的总概率质量。该处理整合生物学相关亚类的置信分布,不增加额外预测信息,与 CrossNN 图形界面及海德堡界面的展示一致。累加分数若超过单项最高分,则采用该类型及合并分数,否则保留最高单项预测。以排名前 1–5 项进行敏感性分析。CrossNN ≥0.4 为可信,<0.4 为不可信;因 Yuan 等未设最低阈值,本研究不另设排除下限[7]。所有分析均遵循分类器特定阈值。
2.6 统计分析
统计及绘图使用 R 4.2.2。以 Shapiro–Wilk 检验及 Q-Q 图评估分布;置信分数和肿瘤纯度差异用 Wilcoxon 秩和检验,效应量以秩二列相关系数 r 表示。总体准确率的 95% 置信区间(CI)采用 Wilson 法;分类器间一致性用 Cohen κ,配对分类结果差异用 McNemar 检验。
非劣效分析使用 CrossNN 减海德堡的配对准确率差,预设临床可接受界值为 −3%。通过 10,000 次自助重采样估计单侧 95% CI;其下限高于 −3% 即判定非劣效。除另有说明外均为双侧检验,p≤0.05 为显著。
3 结果
3.1 队列特征
共 266 份 FFPE 样本,5 份质控失败,15 份无明确诊断,予以排除。最终 246 例,中位诊断年龄 58 岁(2–85),儿童 16 例、成人 230 例,男性 133 例、女性 113 例。成人型弥漫性胶质瘤最常见(45.1%,111/246),其次为脑膜瘤(31%,75/246)。239/246(97%)有分级:WHO 1 级 73/239(31%)、2 级 48/239(20.1%)、3 级 10/239(4.2%)、4 级 108/239(45.2%)。临床人口学资料见表 1。1–205 号为回顾性研究队列,206–246 号用于流程的独立验证(表 S4)。
表 1. 研究队列临床人口学特征概览。
| WHO CNS(2021)肿瘤组别/家族 | 例数 | 性别(男/女) | 中位年龄 | 分级(1/2/3/4) |
|---|---|---|---|---|
| 成人型弥漫性胶质瘤 | 111 | 72/39 | 61 (15–85) | 0/10/7/94 |
| 局限性星形细胞胶质瘤 | 11 | 5/6 | 20 (5–50) | 10/0/0/1 |
| 颅神经与脊旁神经肿瘤 | 3 | 3/0 | 47 (40–66) | 3/0/0/0 |
| 胚胎性肿瘤 | 6 | 6/0 | 12 (5–72) | 0/0/1/4 a |
| 室管膜肿瘤 | 19 | 8/11 | 56 (2–78) | 2/15/1/0 a |
| 胶质神经元与神经元肿瘤 | 4 | 2/2 | 17 (4–39) | 3/1/0/0 |
| 脑膜瘤 | 75 | 25/50 | 61 (29–83) | 52/22/1/0 |
| 儿童型弥漫性高级别胶质瘤 | 9 | 6/3 | 53 (4–76) | 0/0/0/9 |
| 儿童型弥漫性低级别胶质瘤 | 1 | 1/0 | 17 | 1/0/0/0 |
| 鞍区肿瘤 | 1 | 1/0 | 64 | 0/0/0/0 a |
| 血管源性肿瘤 | 2 | 0/2 | 59 (53–64) | 2/0/0/0 |
| 对照(反应性组织、炎症等) | 4 | 4/0 | 65 (49–78) | NA |
| 合计 | 246 | 133/113 | 58 (2–85) | 73/48/10/108 a |
3.2 CrossNN 性能
以整合病理报告为参照,CrossNN 正确分类 181/205(88.3%,95% CI 83.2%–92.0%;图 1A)。154/205(75.1%)给出可信预测(α≥0.4),其中 147/154(95.5%)正确;其余 51/205(24.9%)的准确率为 34/51(66.7%)。
5 例真实类型不在参考库中,输出仍具有生物学意义:2 例 HGG, PAED 低置信度判为中线 IDH 野生型胶质母细胞瘤;2 例脊髓室管膜瘤高置信度判为脊髓室管膜瘤,但无法确定 MYCN 扩增;1 例 PLNTY 低置信度判为节细胞胶质瘤。这些较高层级预测须结合组织学解释。
65/65 脑膜瘤的最高分预测均正确(图 1B)。74 例胶质母细胞瘤中,9 例(12.2%)判为对照组织,2 例(2.7%)为 H3 K27M 突变型弥漫性中线胶质瘤,1 例(1.4%)为低级别胶质瘤/胚胎发育不良性神经上皮肿瘤(LGG, DNT)。9 例毛细胞型星形细胞瘤有 2 例(22.2%)判为 LGG, DNT。5 例高级别 IDH 突变型星形细胞瘤中,1 例判为毛细胞型星形细胞瘤,1 例判为低级别 IDH 突变型星形细胞瘤;另 1 例低级别 IDH 突变型星形细胞瘤判为对照组织。节细胞胶质瘤及形成菊形团的胶质神经元肿瘤未获得正确的最高分预测。
正确与错误预测的置信分数显著不同,中位数 0.66 对 0.24,p<0.001,r=0.353(中等效应;图 1C)。肿瘤纯度也有类似关系,中位数 75% 对 55%,p<0.001,r=0.243(小效应;图 1D)。在可信预测中,除 46 例胶质母细胞瘤中的 5 例(10.9%)外,其余均正确;这 5 例均误判为对照组织(图 S1),复核见广泛坏死或低肿瘤纯度。提高置信阈值只减少可信预测数量,其准确率仍约 95%,未改善两者权衡(图 S2)。
3.3 WHO 类型层级的比较
将 CrossNN 亚类及分数映射至 WHO 类型后,10 例由“正确但不可信”变为“正确且可信”,2 例由“错误且不可信”变为“错误但可信”。前 1–5 项的敏感性分析显示类型判断稳定(图 S3);相比主要分析的前 3 项,取前 5 项仅再使 2 例由正确不可信转为正确可信,不改变任何肿瘤类型预测。
采用前三项映射后,CrossNN 正确 182/205(88.8%,95% CI 83.7%–92.4%;图 2A),可信预测 166/205(81%),其中正确 157/166(94.6%)。正确预测分数仍高于错误者,中位数 0.74 对 0.31,p<0.001,r=0.343(图 S4)。该策略虽略降低可信子集准确率,但增加了正确且可信的绝对数量,故用于后续分析。
海德堡的准确率为 177/205(86.3%,95% CI 81%–90.4%),CrossNN 为 88.8%,配对差 2.5%,McNemar p=0.359,无显著差异。配对差的单侧 95% 自助法 CI 下限为 −0.97%,高于预设 −3%,达到非劣效标准。
3.4 两种分类器的互补性
WHO 类型层级的一致性近乎完全(Cohen κ=0.836)。排除 CrossNN 较高层级输出后,176/205(85.8%)预测一致,其中 170/176(96.6%)正确(图 2B,C);正确且一致者中,135/170(79.4%)两种分类器均可信。10/205(4.9%)预测不一致,其中 CrossNN 正确 4 例,海德堡在另 4 例正确,2 例两者均错。不一致时,分数更高并不总代表正确。全部输出见表 S4。
海德堡在 157/205(76.6%)给出可信预测,其中 147/157(93.6%)与整合诊断一致。34 例海德堡不可信预测中,CrossNN 提供 20 例正确且可信、2 例错误但可信,以及 1 例较高层级且可信(识别出脊髓室管膜瘤,但不能提供 MYCN 状态)。5 例海德堡仅超家族预测中,CrossNN 正确 3 例,但分数均未达可信阈值。9 例海德堡无有效信息的病例中,CrossNN 各提供 1 例正确且可信和错误但可信预测(图 3A)。
CrossNN 的 39 例不可信预测中,海德堡给出 16 例可信预测,其中 11 例正确。2 例被视为较高层级的脊髓室管膜瘤中,海德堡提供 1 例正确且可信的分类(图 3B)。其他预定义较高层级 CrossNN 输出只能与真实诊断对照后回顾性识别,因此本项流程分析不将它们视为预先可识别的较高层级输出。
3.5 临床实施流程
研究比较并行与序贯流程,预设两组:通过组(pass),分类器输出可赋予较高诊断权重;谨慎组(cautious),病理医生需面对两种潜在诊断。并行流程同时使用两种分类器,完全依据 WHO 类型层级的一致性,不考虑分数;一致者入通过组,其余入谨慎组。
序贯流程只有在首个分类器给出不可信、较高层级或无信息结果时才使用第二个。首个预测可信者直接入通过组;需要第二个分类器时,若两者 WHO 类型一致,无论分数均入通过组;不一致及超家族结果入谨慎组。
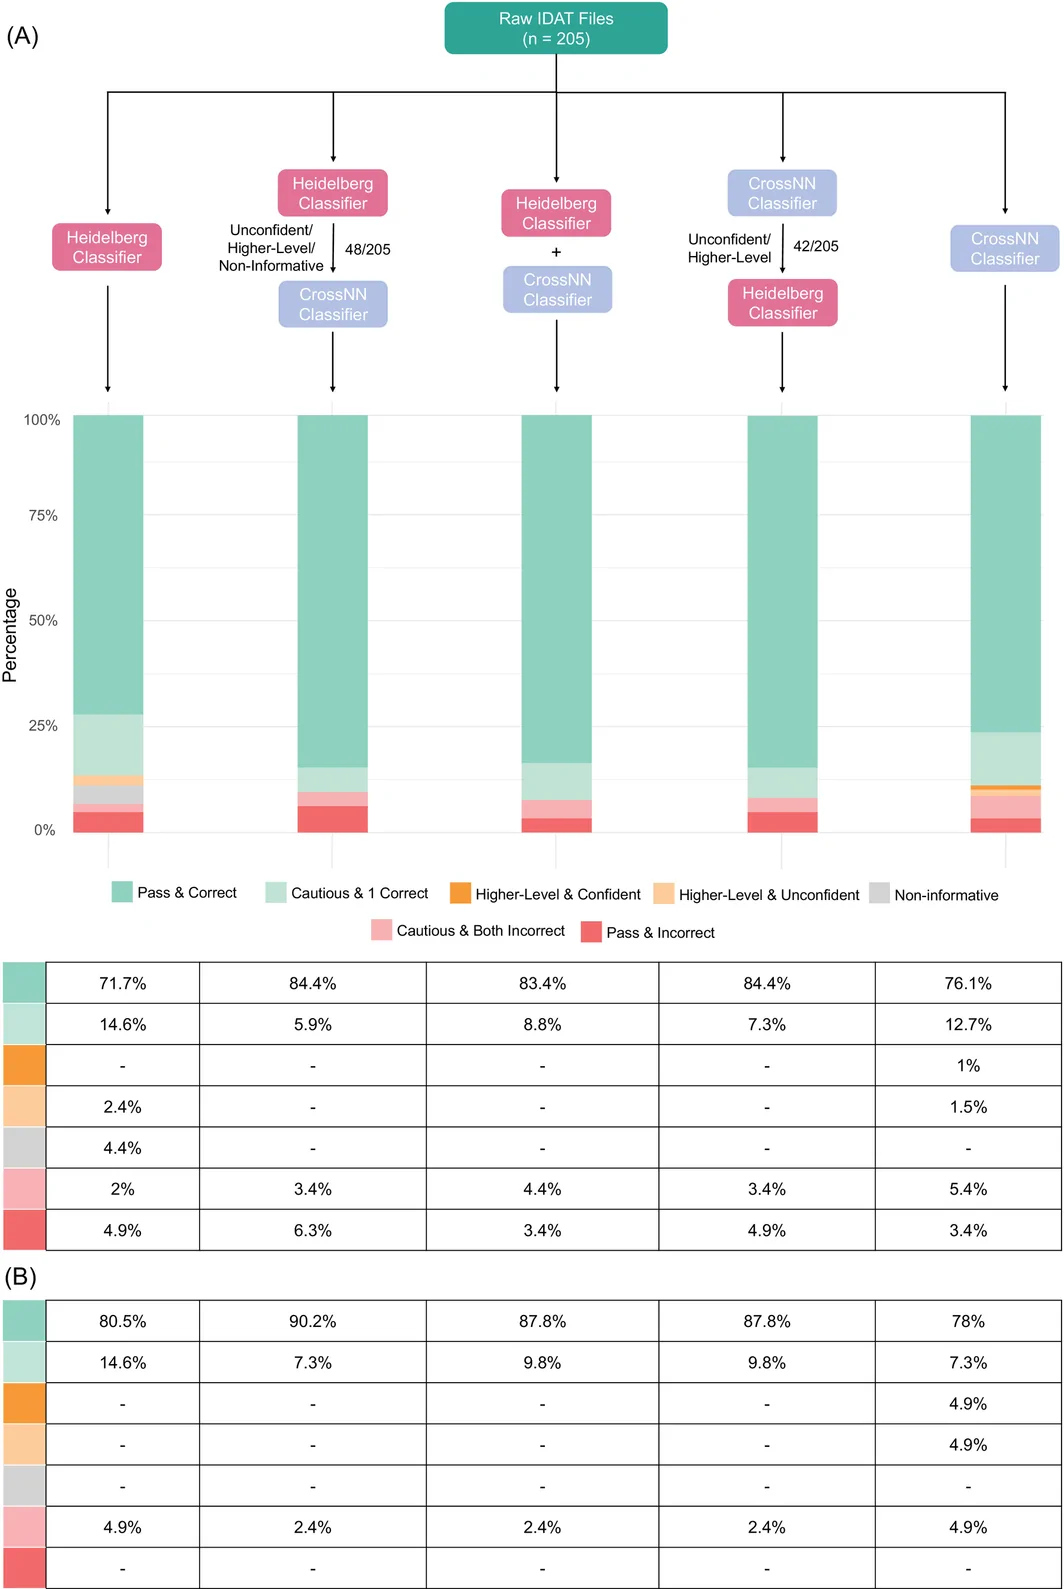
并行使用时,189/205(92.2%)至少有一个正确分类;通过组 178/205(86.8%),准确率 171/178(96.1%;图 4A)。海德堡优先时,48/205 需补 CrossNN,185/205(90.3%)至少一个正确分类;通过组 186/205(90.7%),正确 173/186(93%)。CrossNN 优先时,41/205 需补海德堡,188/205(91.7%)至少一个正确分类;通过组 183/205(89.3%),正确 173/183(94.5%)。
3.6 前瞻性验证
独立验证队列为 41 份样本。原文此处写“206–241 号”,与 3.1 节“206–246 号”及总数 41 不一致;两处原始表述均保留供核对。并行流程中,36/41(87.8%)预测一致、进入通过组,全部符合整合病理诊断(图 4B)。海德堡优先时 8 例需补 CrossNN,37/41(90.2%)进入通过组,组内准确率 100%;CrossNN 优先时 9 例需补海德堡,36/41(87.8%)进入通过组,组内准确率亦为 100%。
图 1.
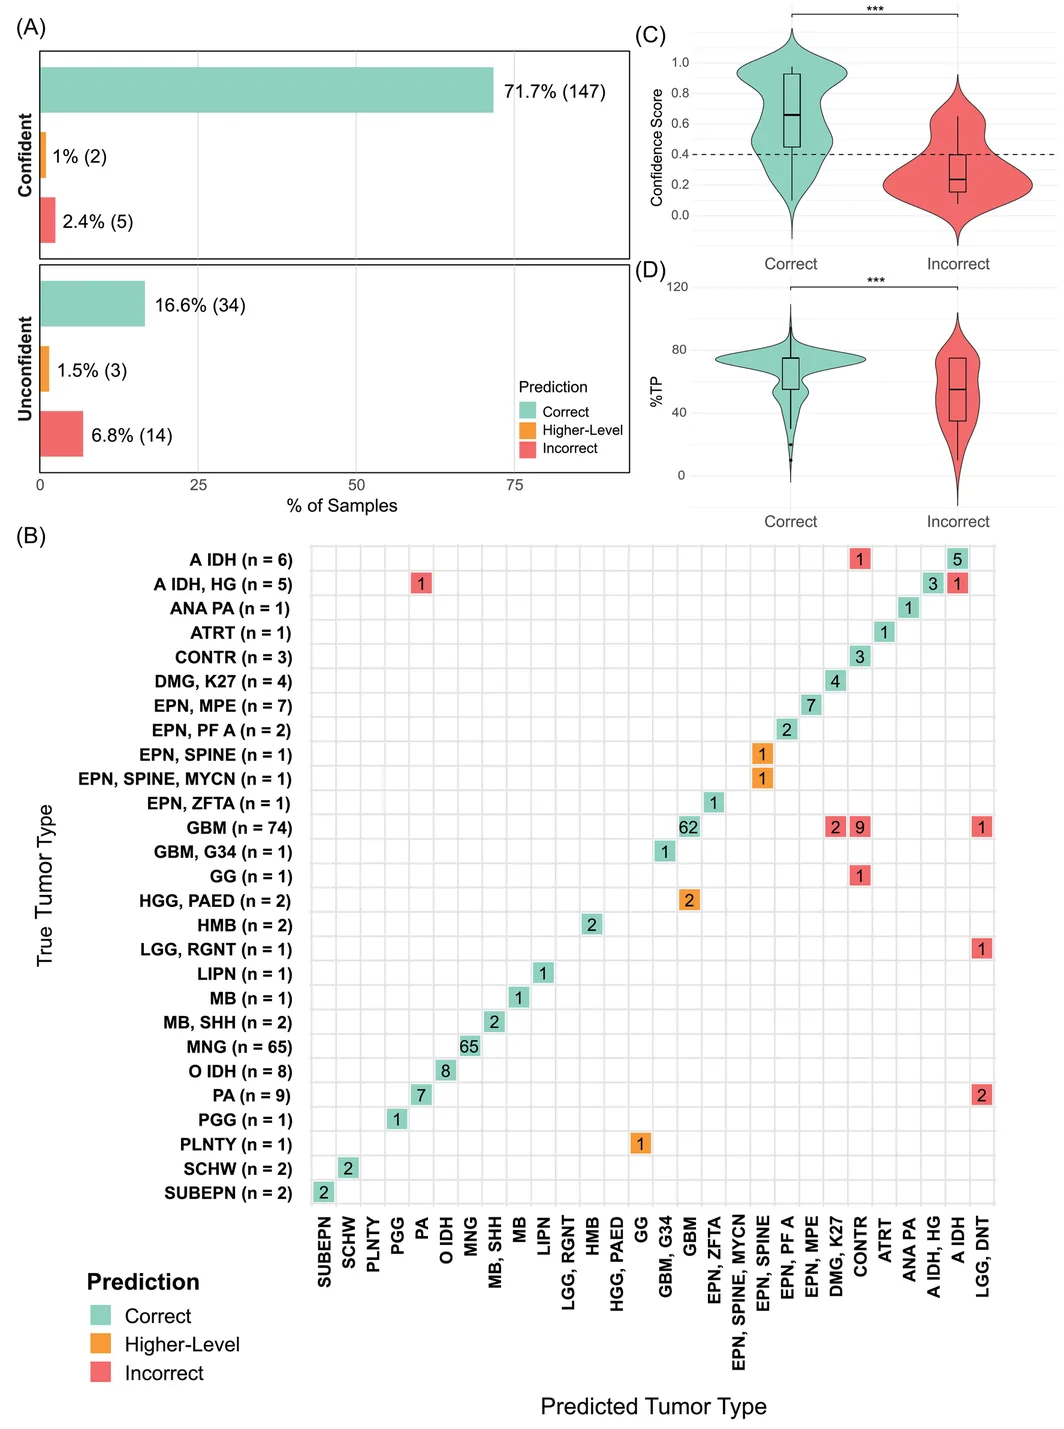
图 2.
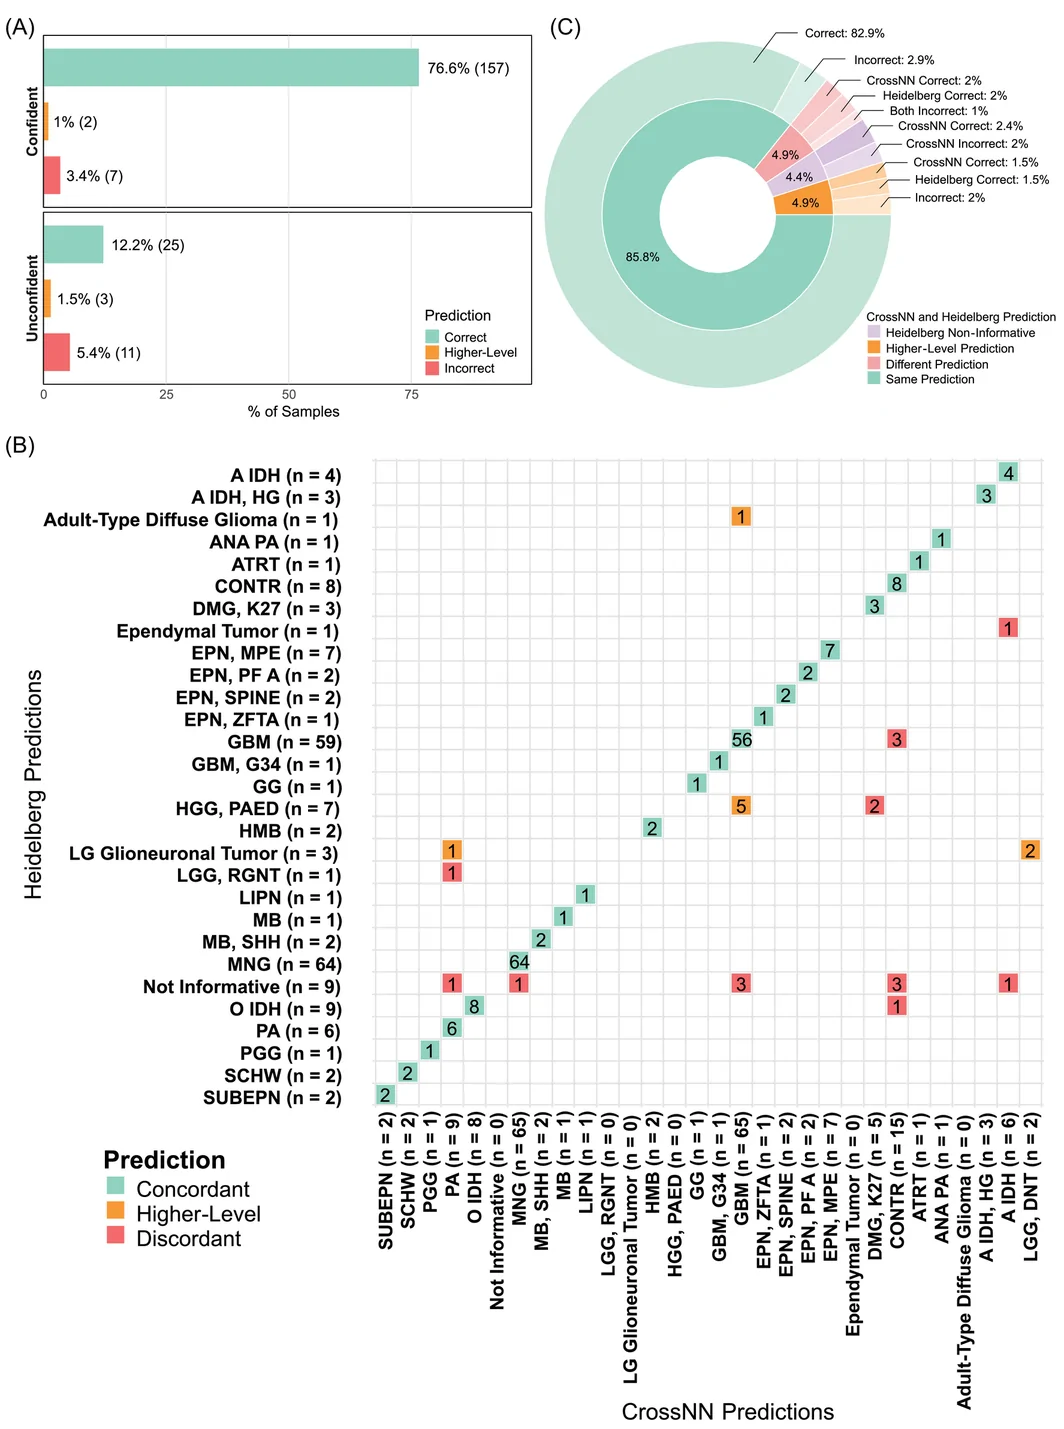
图 3.
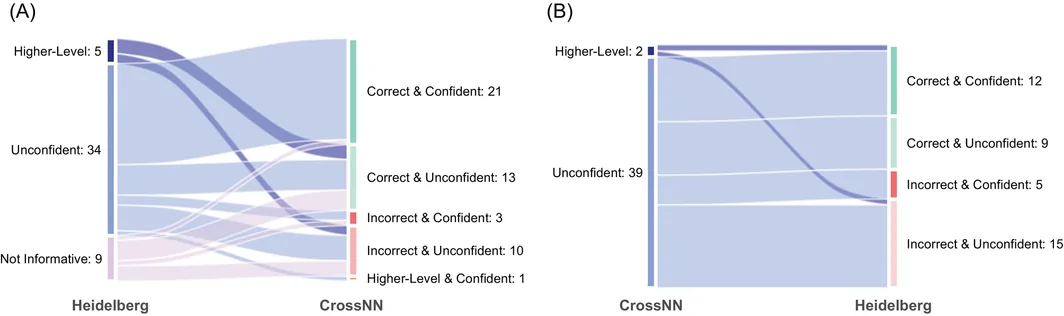
图 4.
4 讨论
甲基化谱是神经肿瘤分类的重要组成,可提高疑难 CNS 肿瘤的诊断准确性。随着分类器增多,理解其输出及相互补充的方式越来越重要。本研究使用真实世界 FFPE 独立队列评价 CrossNN 及其与海德堡的互补作用。CrossNN 可本地部署,无许可要求,便于进入常规流程。其总体表现非劣于海德堡,与 Yuan 等 EPICv2 数据的结果接近,支持跨队列稳健性[7]。两种分类器同时应用时,一致预测大多正确,说明分类器间一致性可作为诊断信心指标。儿童组 16 例中 14 例正确,与海德堡相同;两例错误为节细胞胶质瘤判为对照组织、PLNTY 判为节细胞胶质瘤。
CrossNN 分数与正确率关系密切。高置信预测通常正确,类似海德堡校准分数对诊断有效性的指示作用[10,11]。其分数可纳入临床决策,尤其是疑难病例;但单独使用时,不可信输出应视为不提供有效信息,因为本队列约三分之一不可信预测错误。
映射至 WHO 类型并累加分数,可进一步提高诊断信心。虽然可信预测子集的准确率稍降,但正确且可信的绝对数量上升,使更多患者获得可靠分子分类。值得强调的是,这一处理后可信但错误的预测均为将肿瘤判为对照组织。
判为对照组织反映生物学限制,而非单纯算法失效:这些样本均有广泛坏死或低肿瘤纯度,降解或非肿瘤甲基化信号占优势。既往研究也提示组织构成影响性能[8,13]。因此,当组织学或影像支持恶性时,对照组织预测应触发样本质量及肿瘤含量复核,不能用于否定肿瘤。Wu 等所示甲基化去卷积方法可能改善低纯度样本的分类[13]。
联合两种分类器,使通过组内正确分类病例数较任一单独使用增加近 10%,与 Bethesda v3 分类器的经验相似[14]。并行分析需要双重处理,但错误预测比例低于 5%。少量不一致常涉及生物学近邻,如胶质母细胞瘤与 HGG, PAED,或无信息与对照组织,仍可形成有用的前两项候选。序贯分析仅重测不可信、较高层级或无信息结果,资源消耗较少,通过组正确分类略多,但组内错误也增加。实施方式取决于本地设施与资源;序贯方案可减少第二分类器使用、周转时间及潜在未来许可成本,同时保留大部分获益。前瞻性队列得到相似结果,但规模小,需更大研究确认。并行方案误分类风险最低、最稳健;资源有限时序贯方案可作为务实替代。
临床应用还须注意参考库限制。罕见类型如形成菊形团的胶质神经元肿瘤代表不足,海德堡包含的若干类型在 CrossNN 中缺失,导致它们被归到最接近类别。结合组织学和分子资料,这些输出仍可提供方向,例如 PLNTY 与节细胞胶质瘤之间的近邻预测可引导形态复核。其他错误发生于同一超家族或类别中的相关实体;一例高级别 IDH 突变型星形细胞瘤判为毛细胞型星形细胞瘤,不能用生物学近缘解释,但其海德堡结果也无有效信息。
CrossNN 提供的附加分子信息有限,如不能给出 MYCN 扩增。拷贝数及 MGMT 启动子甲基化对诊断、预后和治疗可能至关重要,需直接从芯片数据补充。虽脑膜瘤识别准确率为 100%,CrossNN 不提供有临床意义的亚分类;其分级仍需组织学结合拷贝数谱。
本研究存在三方面局限。第一,整合诊断已纳入海德堡输出,内在偏倚有利于海德堡;复核不一致病例不能彻底消除偏倚,无法据此确定任何分类器优越。尽管如此,CrossNN 仍取得相近准确率及非劣效结果,支持所见性能。第二,真实世界队列以成人型弥漫性胶质瘤和脑膜瘤等常见类型为主,罕见疑难病例不足,不能对这些类型作可靠结论,需扩大研究。第三,仅研究 Illumina 930k EPIC v2 数据,未直接检验 CrossNN 所宣称的平台独立性或稀疏数据稳健性,其他平台及低 CpG 覆盖数据的可推广性仍需验证。
总之,在独立队列的 WHO CNS5 类型层级,CrossNN 不劣于海德堡,支持其作为无需许可的替代诊断工具。单独使用时,置信分数是临床可解释性的重要指标;联合使用能增加正确且有临床信息价值的分类,为常规实践中的双分类器策略提供依据。
作者贡献、资助及伦理
构思:J.D.、L.v.K.、M.A.、A.S.、K.Z.;方法:J.D.、L.v.K.、T.M.、B.F.、S.K.、M.A.、A.S.、K.Z.;研究实施:J.D.、L.v.K.、M.A.、A.S.、K.Z.;写作:J.D.、L.v.K.、S.K.、K.O.d.B.、T.M.、B.F.、M.A.、A.S.、K.Z.;经费:L.v.K.、K.O.d.B.、S.K.、K.Z.;资源:L.v.K.、S.K.、K.O.d.B.、T.M.、B.F.、M.A.、A.S.、K.Z.;监督:L.v.K.、M.A.、A.S.、K.Z.。资助来自佛兰德癌症协会 Kom op tegen Kanker(KOTK 13571)。作者声明无利益冲突。回顾性样本使用经 UZA 伦理委员会批准(7381;EDGE 004111)。
补充材料
图 S1 为可信预测混淆矩阵,S2 为阈值与覆盖率/准确率关系,S3 为前 1–5 项映射敏感性分析,S4 为映射后分数分布。表 S1 列纳入类型,S2 列不一致病例及保留整合诊断的理由,S3 列 WHO 类型映射,S4 列逐例分类器输出。正文保留全部主表和图注;补充文件入口见下方。
Abstract
DNA methylation profiling is an integral diagnostic tool in the classification of central nervous system (CNS) tumors. While the Heidelberg CNS Tumor Methylation Classifier is widely used to support CNS tumor diagnostics, new classifiers such as CrossNN are emerging. However, their clinical performance and added value within routine diagnostic workflows remain insufficiently explored. In this study, we evaluated the diagnostic performance of the CrossNN classifier in a real‐world CNS tumor cohort and compared it with the established Heidelberg classifier to assess its potential as both a non‐inferior alternative and a complementary tool to improve diagnostic accuracy. A retrospective cohort of CNS tumors profiled using Illumina Human Methylation 930k EPIC v2 BeadChip arrays was analyzed. Classifier outputs were compared with integrated WHO CNS5 (2021) diagnoses. In addition, CrossNN and Heidelberg outputs were harmonized to WHO CNS5 (2021) tumor type levels and evaluated both individually and within sequential and parallel diagnostic workflows. The proposed workflows were subsequently assessed in an independent prospective validation cohort. Among 205 samples, CrossNN correctly classified 88.8% of cases and demonstrated 86.8% concordance with the Heidelberg classifier. CrossNN demonstrated non‐inferior classification performance compared with the Heidelberg classifier. Combining both classifiers increased the number of clinically informative and correct classifications by nearly 10%. This finding was confirmed in an independent validation cohort of 41 samples. In conclusion, these results demonstrate the complementary strength of the CrossNN and Heidelberg classifiers as a dual‐classifier strategy to improve diagnostic confidence and accuracy in routine CNS tumor diagnostics.
1 INTRODUCTION
Accurate classification of central nervous system (CNS) tumors is imperative for optimal patient management. Although formerly determined by histological assessment alone, the classification of these tumors is increasingly supported by molecular parameters. The 5th edition of the World Health Organization (WHO) classification of CNS tumors in 2021 introduced the use of DNA methylation profiling for molecular classification of CNS tumors and resulted in major advances in this field [1, 2].
DNA methylation is a stable epigenetic modification preserved during cell division and plays an important role in tissue‐specific gene regulation [3]. As a result, DNA methylation patterns are highly cell type‐specific. In neoplastic cells, these patterns are characterized by global hypomethylation in combination with focal hypermethylation of promoter regions of tumor suppressor genes, while retaining information on the cell of origin [4]. These tumor‐specific methylation profiles allow discrimination between neoplastic and non‐neoplastic cells, as well as enabling molecular classification of CNS tumors. Furthermore, these methylation signatures remain preserved in formalin‐fixed paraffin‐embedded (FFPE) samples and are unaffected by sample processing or storage conditions, making them suitable for routine diagnostic applications [5].
Building on these principles, machine‐learning‐based classifiers have been developed to categorize CNS tumors based on genome‐wide methylation profiles [6, 7, 8, 9]. Among these, the Heidelberg CNS Tumor Methylation Classifier (hereafter, the Heidelberg classifier) is the most widely used methylation‐based classifier for CNS tumor diagnostics and an important component of current molecular classification approaches. The current classifier is based on the Illumina Human Methylation 930 k EPIC v2 BeadChip array. This random forest‐based algorithm is trained on 7495 array‐based methylation profiles and can distinguish up to 184 CNS subclasses with a 95% subclass‐level accuracy in its latest version (v.12.8; https://epignostix.com/) [10]. For each sample, the classifier generates a prediction with a corresponding calibrated score, indicating the degree of similarity between the sample and the reference profiles in the training database. Sill et al. defined predictions with the Heidelberg classifier as confident when the calibrated score is ≥0.9. Capper et al. described predictions with scores between 0.3 and 0.9 as indicative, and highlighted the need for strong correlation with clinicopathological findings [11]. Predictions with a calibrated score <0.3 are non‐informative. In addition, the EpignostiX report includes a copy number profile and MGMT promoter methylation status prediction. Alternative approaches for whole‐genome methylation profiling have been described, including faster and more cost‐effective methods, such as low‐coverage whole‐genome nanopore sequencing, which show diagnostic performance comparable to array‐based data for CNS tumor classification [8].
Recently, a novel classifier, CrossNN, has been introduced that enables classification of DNA methylation profiles generated across multiple platforms [7]. This classifier is based on a neural network framework designed to handle variable and sparse input data while still being fully explainable. The classifier was trained on the Heidelberg brain tumor classifier v11b4 reference dataset, including 2801 samples across 82 tumor types [6]. At the methylation class family level, CrossNN achieved an overall accuracy of 95.6%, ranging between accuracies of 97% for EPICv2 array data and 89.5% for targeted sequencing data. To enable cross‐platform compatibility, methylation data are binarized prior to classification. For array‐based data, β values greater than 0.6 are encoded as 1, β values of 0.6 or lower as −1, and missing CpG sites as 0. Based on the binarized input, the classifier generates a list of predictions with a confidence score reflecting the similarity between the sample and the reference profiles. Yuan et al. defined confidence cutoffs of 0.4 for microarray‐based data and 0.2 for sequencing‐based data. To date, however, no independent external validation of CrossNN using whole‐genome methylation microarray data has been reported.
In this study we evaluated the performance of the CrossNN classifier in a real‐world CNS tumor cohort and compared it with the established Heidelberg classifier (v12.8). We demonstrate that the performance of CrossNN is non‐inferior to the Heidelberg classifier, supporting its use as an alternative diagnostic approach. Moreover, applying both classifiers simultaneously improves diagnostic accuracy in CNS tumor diagnostics.
2 MATERIALS AND METHODS
2.1 Sample selection
Methylation profiling of CNS tumors has been implemented as part of routine diagnostic practice at the Antwerp University Hospital (UZA, Belgium) since 2022. For this study, tumor samples profiled consecutively between August 2024 and June 2026 were included. Ethical approval for the use of these retrospective samples was obtained from the UZA Ethics Committee (Project ID 7381; EDGE 004111). Histopathological diagnosis and tumor cell content were assessed by two experienced neuropathologists (M.A. and A.S.). Tumor percentages ranged from 10% to 95%. An overview of included tumor entities is provided in Table S1.
2.2 DNA extraction and methylation profiles
DNA was extracted from FFPE tumor tissue using the QIAamp DNA Mini QIAcube Kit (Qiagen, Hilden, Germany) according to the manufacturer's protocol. Bisulfite conversion of 40–250 ng DNA, as quantified with a Qubit dsDNA BR assay kit (Thermo Fisher Scientific), was carried out using the EpiTect Fast Bisulfite Conversion Kits (Qiagen, Hilden, Germany), followed by DNA restoration with the Infinium HD FFPE DNA Restore Kit (Illumina, San Diego, CA, USA). Genome‐wide DNA methylation profiles were obtained using the Illumina Infinium MethylationEPICv2 (EPICv2) BeadChip and iScan device (Illumina, San Diego, CA, USA) according to the manufacturer's protocol with adaptations for FFPE samples. All samples underwent standard quality control as specified by the manufacturer (Illumina, San Diego, CA, USA). Samples failing these metrics or without a definitive diagnosis were excluded from further analysis. All processing steps were performed in accordance with routine diagnostic workflows under ISO 15189 accreditation at UZA.
2.3 Heidelberg classifier prediction
To generate methylation class and class family predictions with the Heidelberg classifier, paired raw intensity array files were processed with the current classifier version (v.12.8) via https://epignostix.com/. For each sample the classifier provided a predicted methylation (super)family and, where applicable, a corresponding (sub)class, along with a calibrated score ranging from 0.1 to 0.99. Superfamily predictions with a score <0.3 were not reported.
2.4 CrossNN prediction
Raw intensity array files were processed in R (v.4.4.1) using the minfi Bioconductor package (v.1.52.1). Beta values were generated with the preprocessIllumina function and subsequently binarized as described by Yuan et al. for input into the CrossNN classifier [7, 12]. The resulting binary matrices were processed locally using the currently available version of the CrossNN brain tumor model (version as of January 23, 2024), available at https://gitlab.com/euskirchen-lab/crossNN. For each sample, the classifier returned a list of predicted methylation classes or class families, with their associated scores ranging from near zero to 0.99. As for the Heidelberg classifier, these scores reflect the degree of similarity between the sample's methylation profile and the reference profiles in the training database.
2.5 Data analysis
For all analyses, the reference (true) tumor type was defined by the integrated histopathological and molecular diagnosis determined by two experienced neuropathologists (M.A. and A.S.), in accordance with WHO CNS5 (2021). As these diagnoses were established with knowledge of the Heidelberg classifier output, potential bias toward this classifier cannot be excluded. To address this, a targeted post‐hoc review was conducted for cases in which CrossNN generated incorrect predictions that differed from the Heidelberg classifier. This post‐hoc review re‐integrated histopathological and molecular data, incorporating CrossNN predictions instead of Heidelberg predictions. None of the 15 reviewed cases led to a change in the final diagnosis (Table S2).
In this study, all results were compared at the WHO CNS5 (2021) tumor type level, as most subclasses currently do not carry direct clinical implications. However, for astrocytoma, IDH‐mutant, the distinction between low‐grade and high‐grade disease was retained caused by its clinical relevance. Additionally, medulloblastoma, SHH‐activated, TP53‐mutant and TP53‐wildtype were grouped as a single tumor type (medulloblastoma, SHH‐activated), as neither classifier differentiates between these subtypes.
Classifier outputs were categorized as either correct, higher‐level, or incorrect classifications. A prediction was considered correct if it matched the WHO CNS5 (2021) tumor type of the integrated reference diagnosis. Predictions at a more specific subclass level within the correct WHO CNS5 (2021) tumor type were also considered correct. Predictions were defined as a higher‐level classification if the Heidelberg classifier did not reach the WHO CNS5 (2021) tumor type level but assigned a correct superfamily prediction (e.g., true tumor type: glioblastoma, IDH‐wildtype; classifier output: adult‐type diffuse glioma). Predictions that not met any of these criteria were considered incorrect.
To account for tumor types that are not represented in the CrossNN reference cohort, certain predefined biologically and clinically related predictions were considered higher‐level classifications rather than incorrect classifications. This approach was intended to avoid penalizing biologically meaningful predictions that could not be resolved more specifically because of limitations in the reference cohort. Specifically, CrossNN glioblastoma, IDH‐wildtype predictions were considered higher‐level predictions for diffuse pediatric‐type high‐grade gliomas, H3‐wildtype and IDH‐wildtype (HGG, PAED), as both entities represent H3‐ and IDH‐wildtype diffuse high‐grade gliomas with overlapping therapeutic options and prognosis. Likewise, CrossNN ganglioglioma predictions were considered higher‐level predictions for polymorphous low‐grade neuroepithelial tumors of the young (PLNTY), as both entities share overlapping methylation‐based features. Finally, because CrossNN does not distinguish MYCN‐amplified spinal ependymoma from other spinal ependymomas, CrossNN spinal ependymoma predictions were considered higher‐level classifications.
The Heidelberg classifier generates predictions across multiple hierarchical levels. To enable direct comparison with the CrossNN classifier, outputs were harmonized to the WHO CNS5 (2021) tumor type level using predefined mapping rules (Table S3). The highest‐scoring prediction at the WHO tumor type level was used as final output. All predictions with a calibrated score <0.3 were classified as non‐informative. Heidelberg predictions with calibrated scores ≥0.9 were considered confident, whereas those with scores between 0.3 and <0.9 were considered unconfident, in accordance with Capper et al. [11].
CrossNN does not generate hierarchical predictions. Therefore, for the primary analysis, the highest‐scoring prediction was used as classifier output. For the comparison with the Heidelberg classifier, WHO‐level outputs were derived from the top three highest‐scoring predictions. When multiple top‐three predictions mapped to the same WHO tumor type (Table S3), their scores were cumulatively summed to reflect the total probability mass assigned to that tumor type. This approach reflects the distribution of classifier confidence across biologically related subclasses rather than introducing additional predictive information, consistent with the presentation of predictions in the graphical user interface of CrossNN (https://crossnn.charite.de) and the Heidelberg classifier. If this combined score exceeded the score of the highest‐ranking individual prediction, the combined score and associated WHO tumor type were used as the final classifier output. Otherwise, the highest‐ranking prediction and its score were retained. A sensitivity analysis was performed to assess the robustness of the harmonization strategy across different values of k (top 1–5 predictions). CrossNN predictions were considered confident at scores ≥0.4 and unconfident at scores <0.4. No minimum cutoff threshold was applied to CrossNN predictions, as none was defined by Yuan et al. [7]. All CrossNN analyses adhered to the classifier‐specific threshold.
2.6 Statistical analysis
All statistical analyses and visualizations were performed using the R software (version 4.2.2). Data distribution was assessed using the Shapiro–Wilk test and visual inspection of quantile‐quantile plots. Differences in confidence scores and tumor purity were assessed using the Wilcoxon rank‐sum test, with effect sizes reported as rank‐biserial correlation coefficients (r). Classifier performance was evaluated using overall accuracy with 95% confidence intervals (CI; Wilson method). Agreement between classifiers was assessed using Cohen's kappa, and differences in paired classification outcomes between CrossNN and the Heidelberg classifier were evaluated using McNemar's test.
Non‐inferiority of CrossNN was assessed using the paired difference in overall accuracy (CrossNN—Heidelberg), with a predefined non‐inferiority margin of −3%, chosen to represent a clinically acceptable difference in classification performance. A one‐sided 95% bootstrap CI was estimated based on 10,000 resamples. Non‐inferiority was concluded if the lower bound of this confidence interval exceeded the predefined margin. All statistical analyses were two‐sided unless otherwise specified, and a p‐value ≤0.05 was considered statistically significant.
3 RESULTS
3.1 Study cohort characteristics
The study cohort included 266 FFPE samples that underwent routine DNA methylation profiling at UZA between August 2024 and June 2026. Of these, 5/266 failed quality metrics and 15/266 did not receive a definitive diagnosis and were excluded. Median age at diagnosis was 58 years (range 2–85), including 16 pediatric and 230 adult cases (Table 1). The cohort included 133 male and 113 female patients. Adult‐type diffuse gliomas were most common (45.1%, 111/246), followed by meningiomas (31%, 75/246). Tumor grades were available for 97% (239/246) of cases, with 31% (73/239) WHO grade 1, 20.1% (48/239) WHO grade 2, 4.2% (10/239) WHO grade 3, and 45.2% (108/239) WHO grade 4. Clinicodemographic characteristics are provided in Table 1. The retrospective study cohort comprised samples 1–205, while samples 206–246 were used for independent validation of the proposed diagnostic workflows (Table S4).
Table 1. Overview of the clinicodemographic characteristics of the study cohort.
| WHO CNS (2021) tumor group/family | #Total | Sex (M/F) | Median age | Grade (1/2/3/4) |
|---|---|---|---|---|
| Adult‐type diffuse gliomas | 111 | 72/39 | 61 (15–85) | 0/10/7/94 |
| Circumscribed astrocytic gliomas | 11 | 5/6 | 20 (5–50) | 10/0/0/1 |
| Cranial and paraspinal nerve tumors | 3 | 3/0 | 47 (40–66) | 3/0/0/0 |
| Embryonal tumors | 6 | 6/0 | 12 (5–72) | 0/0/1/4 a |
| Ependymal tumors | 19 | 8/11 | 56 (2–78) | 2/15/1/0 a |
| Glioneuronal and neuronal tumors | 4 | 2/2 | 17 (4–39) | 3/1/0/0 |
| Meningioma | 75 | 25/50 | 61 (29–83) | 52/22/1/0 |
| Pediatric‐type diffuse high‐grade gliomas | 9 | 6/3 | 53 (4–76) | 0/0/0/9 |
| Pediatric‐type diffuse low‐grade gliomas | 1 | 1/0 | 17 | 1/0/0/0 |
| Tumors of the sellar region | 1 | 1/0 | 64 | 0/0/0/0 a |
| Vascular tumors | 2 | 0/2 | 59 (53–64) | 2/0/0/0 |
| Control (reactive tissue, inflammation, etc.) | 4 | 4/0 | 65 (49–78) | NA |
| Total | 246 | 133/113 | 58 (2–85) | 73/48/10/108 a |
3.2 Evaluation of CrossNN performance
Using the WHO CNS5 (2021) diagnosis of the integrated pathology report as reference standard, the CrossNN classifier correctly classified 88.3% of samples (181/205, 95% CI: 83.2%–92.0%, Figure 1A). In 75.1% (154/205) of cases, CrossNN produced a confident prediction (α ≥ 0.4), of which 95.5% (147/154) were correctly classified. In the remaining 24.9% of cases (51/205), accuracy was 66.7% (34/51).
Figure 1.
In five samples, CrossNN did not identify the exact WHO tumor type, as these were not represented in the classifier's reference cohort. Instead, the classifier generated biologically meaningful higher‐level predictions that may support the final diagnosis when interpreted alongside histopathological findings. Specifically, two HGG, PAED samples were classified as midline glioblastomas IDH‐wildtype with low confidence; two spinal ependymoma samples were assigned to spinal ependymoma with high confidence, although MYCN amplification status could not be resolved; and one PLNTY sample was classified as ganglioglioma with low confidence.
Across tumor entities, highest‐ranking predictions were correct for all meningioma (MNG) cases (65/65, Figure 1B). Several entities, however, showed misclassifications against the integrated diagnosis in the pathology report. Among glioblastomas (GBM), 12.2% (9/74) were predicted as control tissue (CONTR), while 2.7% (2/74) and 1.4% (1/74) were assigned to diffuse midline glioma H3 K27M‐mutant (DMG, K27) and low‐grade glioma, dysembryoplastic neuroepithelial tumor (LGG, DNT), respectively. In pilocytic astrocytoma (PA), 22.2% (2/9) of samples were misclassified as LGG, DNT. For high‐grade astrocytoma, IDH‐mutant (A IDH, HG), the classifier predicted 1/5 samples as PA and 1/5 as low‐grade astrocytoma, IDH‐mutant (A IDH). One A IDH was predicted as control tissue. No correct highest‐ranking predictions were generated for ganglioglioma (GG) or rosette‐forming glioneuronal tumor (LGG, RGNT).
Confidence scores differed significantly between correct and incorrect predictions, with a moderate effect size (p < 0.001, r = 0.353, Figure 1C). Correct classifications were associated with higher confidence scores (median 0.66 vs. 0.24). Tumor purity showed a similar pattern, with a small effect size (p < 0.001, r = 0.243, Figure 1D) and a higher median tumor purity in correct compared to incorrect predictions (75% vs. 55%). Among confident predictions, all but 5/46 (10.9%) GBM cases were predicted correctly. These five cases were misclassified as control tissue (Figure S1). Histopathological review showed that these samples were characterized by extensive necrosis or low tumor purity.
Exploration of alternative confidence thresholds did not improve the trade‐off between the proportion of confident predictions and accuracy within confident predictions (Figure S2). Increasing the threshold reduced the number of confident predictions, while accuracy within this subset remained stable at approximately 95%.
3.3 CrossNN and Heidelberg classifier performance at the WHO entity level output
To enable direct comparison between the CrossNN and Heidelberg classifiers, CrossNN subclass predictions were harmonized to the WHO CNS5 (2021) tumor type level by mapping lower‐level (sub)class predictions and their associated confidence scores to their corresponding WHO tumor type (Table S3). Using this strategy, 10 samples were reclassified from previously “correct & unconfident” to “correct & confident”, and two predictions that were previously “incorrect & unconfident” became “incorrect & confident”. To assess the robustness of this harmonization strategy, a sensitivity analysis was performed using values of k ranging from 1 to 5. WHO‐level classifications remained stable across all k‐values (Figure S3). Compared with the primary analysis (k = 3), increasing k to 5 reclassified only two cases from “correct & unconfident” to “correct & confident”, without changing any tumor type predictions.
Using the harmonization strategy based on the top three CrossNN predictions, CrossNN correctly identified 88.8% (182/205, 95% CI: 83.7%–92.4%) of cases (Figure 2A). Confident predictions were obtained in 81% (166/205) of cases, with an accuracy of 94.6% (157/166) within this group. Correct predictions remained associated with higher confidence scores than incorrect predictions, with a moderate effect size (median 0.74 vs. 0.31, p < 0.001, r = 0.343, Figure S4). As this strategy increased the number of “correct & confident” predictions, despite a small decrease in accuracy, it was used for all subsequent analyses.
Figure 2.
At the WHO tumor type level, CrossNN achieved an accuracy of 88.8% (182/205, 95% CI: 83.7%–92.4%), compared with 86.3% (177/205, 95% CI: 81%–90.4%) for the Heidelberg classifier. The observed paired accuracy difference was 2.5%. No significant difference in accuracy was observed between both classifiers (McNemar test, p = 0.359). Furthermore, CrossNN met the predefined criterion for non‐inferiority, as the lower bound of the one‐sided 95% bootstrap confidence interval (10,000 resamples) for the paired accuracy difference of −0.97% exceeded the predefined non‐inferiority margin of −3%.
3.4 Heidelberg and CrossNN as complementary tools
The Heidelberg and CrossNN classifiers showed an almost perfect agreement at the WHO tumor type level (Cohen's κ = 0.836). Concordant predictions, excluding higher‐level CrossNN outputs, were observed in 85.8% (176/205) of samples, of which 96.6% (170/176) were correct (Figure 2B,C). Among the correct and concordant cases, both classifiers were confident in 79.4% (135/170) of cases. Discordant predictions occurred in 4.9% (10/205) of cases. Within this group, CrossNN correctly classified four cases and Heidelberg four different cases. In two cases, neither classifier was correct. Notably, higher confidence scores did not consistently associate with correct classification among discordant cases. An overview of all predictions is provided in Table S4.
Next, we evaluated whether one classifier could provide clinically useful information when the other generated an unconfident, higher‐level, or non‐informative result. The Heidelberg classifier generated confident predictions (α ≥ 0.9) in 76.6% (157/205) of the study cohort, of which 93.6% (147/157) were concordant with the integrated pathology diagnosis. Among the 34 unconfident Heidelberg predictions, CrossNN generated 20 “correct & confident” classifications, two “incorrect & confident” classifications and one “higher‐level & confident” classification by correctly identifying spinal ependymoma without MYCN amplification status (Figure 3A). In accordance with the predefined evaluation criteria, this prediction was considered a higher‐level classification. Of the five Heidelberg superfamily predictions, CrossNN correctly identified three cases. However, none reached a confidence score above 0.4 and were therefore categorized as “correct & unconfident” (Figure 3A). Among the nine non‐informative (α < 0.3) Heidelberg outputs, CrossNN produced one “correct & confident” and one “incorrect & confident” prediction.
Figure 3.
CrossNN generated 39 unconfident predictions (Figure 3B). Within this subset, the Heidelberg classifier generated 16 confident predictions, of which 11 were correct. Among the two spinal ependymoma predictions, which were considered higher‐level as CrossNN does not distinguish MYCN amplification status, Heidelberg produced one “correct & confident” classification. Other predefined higher‐level CrossNN outputs could only be recognized retrospectively after comparison with the reference diagnosis and were therefore not considered higher‐level predictions in this analysis.
3.5 Clinical implementation of the Heidelberg and CrossNN classifier
To assess the clinical utility of combining both classifiers, we evaluated parallel and sequential diagnostic workflows and predefined two outcome categories: a pass‐group, in which the classifier output provides a high diagnostic weight, and a cautious group in which the pathologist would receive two potential diagnoses.
In the parallel workflow, both classifiers were applied simultaneously. Here, classification was based solely on concordance between the two classifiers, independent of confidence. Cases were assigned to the pass‐group when both classifiers agreed at the WHO tumor type level. All remaining cases were assigned to the cautious group.
In the sequential workflow, the second classifier was applied only if the first generated an unconfident, higher‐level, or non‐informative result. Cases were assigned to the pass‐group if the first classifier produced a confident prediction. Once a second classifier was applied, cases were assigned to the pass‐group if the second classifier agreed at the WHO CNS5 (2021) tumor type level with the first classifier, independent of confidence. All discordant results, including superfamily predictions, were assigned to the cautious‐group.
When both classifiers were applied simultaneously, at least one correct classification was provided in 92.2% (189/205, Figure 4A). The pass‐group contained 86.8% (178/205) of cases and achieved an accuracy of 96.1% (171/178).
Figure 4.
In the sequential workflow, when the Heidelberg classifier was used first, 48/205 cases required additional CrossNN analysis. This approach yielded at least one correct classification in 90.3% (185/205). The pass‐group comprised 90.7% (186/205) of cases, with an accuracy of 93% (173/186). When CrossNN was applied first, 41/205 cases proceeded to Heidelberg testing. This approach resulted in at least one correct classification in 91.7% (188/205) of cases, with 89.3% (183/205) assigned to the pass‐group and an accuracy of 94.5% (173/183).
3.6 Prospective validation of the clinical decision workflow
To evaluate the clinical applicability of the proposed diagnostic workflows, we performed a prospective validation in an independent cohort of 41 samples (samples 206–241, Table S4). When both classifiers were applied simultaneously, 87.8% (36/41) of cases showed concordant predictions and were therefore assigned to the pass group (Figure 4B). Within this group, all predictions were concordant with the integrated pathology diagnosis. In the Heidelberg‐first sequential workflow, eight cases proceeded to CrossNN testing. This resulted in 90.2% (37/41) of cases being assigned to the pass group, with an accuracy of 100% within this group. In the CrossNN‐first sequential workflow, nine cases required additional Heidelberg analysis, yielding 87.8% (36/41) pass group cases with an accuracy of 100%.
4 DISCUSSION
DNA methylation profiling is an essential component of tumor classification in neuro‐oncology, improving diagnostic accuracy, particularly for diagnostically challenging CNS tumors. With the increasing availability of methylation‐based classifiers, understanding how their outputs should be interpreted and how different classifiers may complement each other has become increasingly important. In this study, we evaluated the CrossNN classifier in an independent validation cohort of real‐world FFPE samples and examined its complementarity with the Heidelberg classifier in a clinical setting. CrossNN can be implemented locally without licensing requirements, facilitating its use in routine clinical workflows. Overall, CrossNN demonstrated non‐inferiority to the Heidelberg classifier. In our cohort, its classification accuracy aligned closely with the performance reported by Yuan et al. for EPICv2 data, supporting the robustness of the model across cohorts [7]. When both classifiers were applied simultaneously, concordant predictions were predominantly correct, indicating that inter‐classifier agreement can serve as a marker of diagnostic confidence. Notably, CrossNN also performed well in pediatric tumors, a subgroup in which molecular profiling is often indispensable. In this subset, 14 of 16 cases were classified correctly, matching the performance of the Heidelberg classifier. The two incorrect classifications involved (i) a ganglioglioma predicted as control tissue and (ii) a PLNTY predicted as ganglioglioma.
Our results confirm a strong association between CrossNN confidence scores and classification accuracy. High confidence predictions were generally correct, demonstrating their value as indicators of diagnostic reliability. This mirrors the interpretation of the calibrated score use in the Heidelberg classifier, where confidence metrics determine whether a result is considered diagnostically informative [10, 11]. Accordingly, CrossNN confidence scores can be incorporated into clinical decision‐making, particularly in diagnostically challenging cases. Furthermore, unconfident CrossNN outputs should be considered non‐informative when used as a standalone tool, as approximately one‐third of unconfident predictions were incorrect within our cohort.
Harmonization of classifier outputs to WHO CNS5 (2021) tumor type levels with cumulative summation of confidence scores further enhanced diagnostic confidence. Although this approach resulted in a small decrease in accuracy within the confident prediction subset, it increased the absolute number of correct and confident predictions, translating into additional patients receiving a reliable molecular classification. Importantly, all confident but incorrect predictions exclusively involved tumors misclassified as control tissue.
Misclassification of CNS tumors as control tissue reflects biological limitations rather than a failure of the classification algorithm. Each case was characterized by extensive necrosis or low tumor purity, conditions in which degraded or non‐neoplastic methylation signals dominate the methylation profile. Similar observations have been reported previously, highlighting the impact of tissue composition on classifier performance [8, 13]. These findings emphasize that a control tissue prediction should lead to careful reassessment of sample quality and tumor content rather than being interpreted against a neoplastic process, particularly when histopathological or radiological findings suggest a malignancy. Emerging approaches such as methylation‐based deconvolution may overcome this limitation, as demonstrated by Wu et al., by improving classifier performance in low‐purity samples [13].
CrossNN demonstrated added value as a complementary tool to the Heidelberg classifier. The use of both classifiers resulted in nearly 10% more correctly classified cases in the pass group than either classifier alone, consistent with observations reported for the Bethesda v3 classifier [14]. Although the resource‐intensive strategy of applying both classifiers simultaneously requires dual analysis, it resulted in fewer incorrect predictions, remaining below 5%. Discordant results were observed in a small subset of cases. However, these often involved closely related entities, such as glioblastoma and HGG, PAED, or non‐informative and control tissue outputs, thereby still providing an informative top‐2 prediction to support diagnostic decision‐making. A less resource‐demanding sequential approach, in which unconfident, higher‐level, or non‐informative outputs from one classifier were re‐analyzed using the second classifier, produced slightly more correct classifications within the pass group. However, this strategy also increased the number of incorrect predictions within this group. Practical implementation of the dual‐classifier approach will depend on local infrastructure and resource availability. While simultaneous application of both classifiers increases computational and analytical workload, a sequential workflow may offer a more feasible alternative by limiting second‐classifier analyses to cases with unconfident initial predictions, thereby reducing turnaround time and potential future licensing costs while retaining most of the diagnostic benefit observed in this study. Importantly, prospective evaluation in an independent cohort yielded similar findings, supporting the clinical applicability of these workflows. However, the prospective cohort was limited in size, requiring larger prospective studies to confirm these observations. Based on these findings, simultaneous application of both classifiers represents the most robust strategy with the lowest risk of misclassification, while the sequential method may serve as a pragmatic alternative in resource‐limited settings.
Several limitations of the CrossNN classifier are important for clinical implementation. Tumor misclassification largely reflects limitations of the reference dataset. Rare entities (e.g., rosette‐forming glioneuronal tumors) are underrepresented, and several tumor types included in the Heidelberg classifier are absent in CrossNN. As a result, tumors not represented in the CrossNN reference cohort are assigned to the closest available class. When interpreted alongside histopathological and molecular findings, such outputs can still provide meaningful clinical guidance. For example, a CrossNN prediction of ganglioglioma as PLNTY may still direct the pathologist toward the correct diagnosis through morphological assessment. Further misclassification occurred among biologically related entities within the same superfamily or class. One remaining misclassification of A IDH, HG as PA could not be attributed to biological relatedness. However, this case also yielded a non‐informative output with the Heidelberg classifier. Beyond misclassification, CrossNN provides limited additional molecular information, such as MYCN amplification. As copy number profiles and MGMT promoter methylation status are clinically relevant, and in some entities essential for diagnosis, prognosis, and treatment planning, this represents a clinical gap. This limitation can be overcome by deriving complementary copy number profiles directly from the array data. Finally, although CrossNN identified meningiomas with 100% accuracy, it does not provide subclassification, which remains important for clinical decision‐making. In these cases, histological assessment combined with copy number profiling remains essential for tumor grading.
Certain limitations of this study should be considered when interpreting the results. First, classifier outputs were benchmarked against the integrated pathology diagnosis, which incorporates the Heidelberg classifier and therefore introduces an inherent reference bias in favor of Heidelberg. Although discordant cases were re‐evaluated, such bias cannot be fully eliminated, preventing definitive claims regarding the superiority of one classifier over the other. Importantly, despite this potential bias, CrossNN achieved a comparable overall accuracy and met the predefined criterion for non‐inferiority. As any residual reference bias would be expected to favor Heidelberg, these findings support the robustness of the observed CrossNN performance. Second, the cohort reflects real‐world diagnostic case distribution and was therefore dominated by common entities such as adult‐type diffuse gliomas and meningiomas, while rare and diagnostically challenging tumor types were underrepresented. Although this enhances clinical relevance, it restricts reliable assessment of classifier performance for rare tumor types and prevents definitive conclusions regarding performance in these specific diagnostic cases. Future studies including larger numbers of rare CNS tumor types are needed to further evaluate its performance across the full spectrum of CNS tumors. Third, this study only evaluated data generated using the Illumina Human Methylation 930k EPIC v2 array. Although platform‐independence and robustness to sparse data have been reported as key advantages of CrossNN, our study did not directly assess these properties. Therefore, generalizability to other methylation platforms or to datasets with reduced CpG coverage remains to be assessed in future studies.
In conclusion, the CrossNN classifier proved to be non‐inferior to the Heidelberg classifier in an independent cohort at the WHO CNS5 (2021) tumor entity level, supporting its potential use as an alternative, license‐free diagnostic tool. Confidence scores showed to be an important indicator for clinical interpretability when used as a standalone classifier. Moreover, combining CrossNN and the Heidelberg classifier increased the number of correct and clinically informative classifications, highlighting the potential value of a dual‐classifier strategy for improving diagnostic confidence in routine practice.
AUTHOR CONTRIBUTIONS
Conceptualization: J.D., L.v.K., M.A., A.S., and K.Z. Methodology: J.D., L.v.K., T.M., B.F., S.K., M.A., A.S., and K.Z. Investigation: J.D., L.v.K., M.A., A.S., and K.Z. Writing: J.D., L.v.K., S.K., K.O.d.B., T.M., B.F., M.A., A.S., and K.Z. Funding Acquisition: L.v.k., K.O.d.B., S.K., K.Z. Resources: L.v.K., S.K., K.O.d.B., T.M., B.F., M.A., A.S., and K.Z. Supervision: L.v.K., M.A., A.S., and K.Z.
FUNDING INFORMATION
Kom op tegen Kanker (Stand up to Cancer), the Flemish cancer society (KOTK 13571).
CONFLICT OF INTEREST STATEMENT
The authors declare no conflicts of interest.
ETHICS STATEMENT
Ethical approval for the use of retrospective samples was obtained from the UZA Ethics Committee (Project ID 7381; EDGE 004111).
Supporting information
Figure S1: Confusion matrix of the confident (α ≥ 0.4) highest‐ranking CrossNN predictions (n = 154). Absolute case counts are shown in each cell. Green cells display predictions concordant with the integrated pathology report. Orange cells represent correct higher‐level predictions for tumor entities not represented in the classifier output. Red cells indicate discordant predictions.
Figure S2: Relationship between confidence threshold, proportion of confident predictions, and accuracy within confident predictions for the CrossNN classifier.
Figure S3: Sensitivity analysis of the CrossNN WHO‐level harmonization strategy across different values of k (top 1–5 predictions).
Figure S4: Violin plot showing the distribution of CrossNN confidence scores grouped by prediction correctness after standardization to WHO CNS5 (2021) tumor type level (n correct = 182, n incorrect = 18). The dashed line represents the confidence cutoff of the CrossNN classifier. Overall differences between correct and incorrect predictions were assessed using the Wilcoxon rank‐sum test (***p < 0.001).
Table S1: Overview of included tumor entities of the study cohort.
Table S2: Overview of cases with discordant CrossNN and Heidelberg predictions in which CrossNN did not match the final integrated diagnosis. For each case, the rationale underlying the retained integrated diagnosis is provided.
Table S3: Overview of included WHO tumor entities and their associated (sub)classes used to harmonize classifier outputs.
Table S4: Case‐level overview of Heidelberg and CrossNN classifier outputs (n = 239). For each case, the integrated reference diagnosis, Heidelberg prediction and score, top three CrossNN predictions and scores, harmonized WHO‐level CrossNN output and score, and the final classification categories used in the study are shown.
ACKNOWLEDGEMENTS
Project funded by Kom op tegen Kanker (Stand up to Cancer), the Flemish cancer society (KOTK 13571).
During the preparation of this work the first author used ChatGPT (v.5.2) in order to edit language. After using this tool/service, the authors reviewed and edited the content as needed and take full responsibility for the content. No final decision‐making processes relied on AI tools.
DATA AVAILABILITY STATEMENT
The Illumina Human Methylation 930k EPIC v2 BeadChip array data have been deposited in the NCBI's Gene Expression Omnibus (GEO) database (GSE325845).
References
- 1 Louis DN , Perry A , Wesseling P , Brat DJ , Cree IA , Figarella‐Branger D , et al. The 2021 WHO classification of tumors of the central nervous system: a summary. Neuro‐Oncology. 2021;23(8):1231–1251. 10.1093/neuonc/noab106 34185076 PMC8328013
- 2 Aldape K , Capper D , von Deimling A , Giannini C , Gilbert MR , Hawkins C , et al. cIMPACT‐NOW update 9: recommendations on utilization of genome‐wide DNA methylation profiling for central nervous system tumor diagnostics. Neuro‐Oncol Adv. 2025;7(1):vdae228. 10.1093/noajnl/vdae228 PMC1178859639902391
- 3 Galbraith K , Snuderl M . DNA methylation as a diagnostic tool. Acta Neuropathol Commun. 2022;10(1):71. 10.1186/s40478-022-01371-2 35527288 PMC9080136
- 4 DNA methylation and cancer. Advances in genetics [Internet]. USA: Academic Press; 2010 [cited 2026 Apr 8]. p. 27–56. 10.1016/B978-0-12-380866-0.60002-2 20920744
- 5 Davalos V , Esteller M . Cancer epigenetics in clinical practice. CA Cancer J Clin. 2023;73(4):376–424. 10.3322/caac.21765 36512337
- 6 Capper D , Jones DTW , Sill M , Hovestadt V , Schrimpf D , Sturm D , et al. DNA methylation‐based classification of central nervous system tumours. Nature. 2018;555(7697):469–474. 10.1038/nature26000 29539639 PMC6093218
- 7 Yuan D , Jugas R , Pokorna P , Sterba J , Slaby O , Schmid S , et al. crossNN is an explainable framework for cross‐platform DNA methylation‐based classification of tumors. Nat Cancer. 2025;6(7):1283–1294. 10.1038/s43018-025-00976-5 40481322 PMC12296554
- 8 Vermeulen C , Pagès‐Gallego M , Kester L , Kranendonk MEG , Wesseling P , Verburg N , et al. Ultra‐fast deep‐learned CNS tumour classification during surgery. Nature. 2023;622(7984):842–849. 10.1038/s41586-023-06615-2 37821699 PMC10600004
- 9 Singh O , Abdullaev Z , Aldape K . PATH‐01. The NCI/Bethesda DNA methylation classifier: an important diagnostic tool for CNS tumors. Neuro‐Oncol Pediatr. 2025;1(Supplement_1):wuaf001.280. 10.1093/neuped/wuaf001.280
- 10 Sill M , Schrimpf D , Patel A , Sturm D , Jäger N , Sievers P , et al. Advancing CNS tumor diagnostics with expanded DNA methylation‐based classification. Cancer Cell. 2025;44(2):340. 10.1016/j.ccell.2025.11.002 41349541
- 11 Capper D , Stichel D , Sahm F , Jones DTW , Schrimpf D , Sill M , et al. Practical implementation of DNA methylation and copy‐number‐based CNS tumor diagnostics: the Heidelberg experience. Acta Neuropathol (Berl). 2018;136(2):181–210. 10.1007/s00401-018-1879-y 29967940 PMC6060790
- 12 Fortin JP , Triche TJ Jr , Hansen KD . Preprocessing, normalization and integration of the Illumina HumanMethylationEPIC array with minfi. Bioinformatics. 2017;33(4):558–560. 10.1093/bioinformatics/btw691 28035024 PMC5408810
- 13 Wu Z , Abdullaev Z , Pratt D , Chung HJ , Skarshaug S , Zgonc V , et al. Impact of the methylation classifier and ancillary methods on CNS tumor diagnostics. Neuro‐Oncol. 2021;24(4):571–581. 10.1093/neuonc/noab227 PMC897223434555175
- 14 Brandenburg C , Starzetz T , Luger A , Singh O , Aldape KD , Schweizer L . PATH‐63. Analysis of histological, molecular and preanalytic features of unclassifiable CNS specimens: comparison of the Heidelberg v12.8 and Bethesda v3 methylation‐based brain tumor classifiers. Neuro‐Oncol. 2025;27(Supplement_5):v255. 10.1093/neuonc/noaf201.1015