- PDGFRA 免疫组化可高特异、高敏感地提示中枢神经系统肿瘤中的 PDGFRA 扩增。
- 建议纳入神经病理常规抗体组合,辅助分子分层与预后判断。
- 本页为 PMC OA 全文中英双语(PMC13535536)。
正文
PDGFRA 基因扩增现被认为是中枢神经系统肿瘤中具有诊断和预后意义的分子改变。近期,它已被引入为 IDH 突变型星形细胞瘤的不良标志,其存在足以支持 4 级判定[1]。它也常见于 IDH 野生型、H3 野生型弥漫性儿童型高级别胶质瘤,尤其是 RTK1 亚组[2,3]。此外,PDGFRA 突变是黏液样胶质神经元肿瘤(MGNT)的诊断标志[4]。常用检测方法包括荧光原位杂交(FISH)、下一代测序(NGS)、比较基因组杂交及 SNP 芯片,以及近期应用的 DNA 甲基化分析所得拷贝数变异(CNV)。面对日益复杂的诊断谱,神经病理医生需要可及的常规工具。因此,我们在已知 PDGFRA 状态、经甲基化分析的高级别胶质瘤队列(HGG,114 例)中评估免疫组化检测扩增的敏感度和特异度,并在胶质及胶质神经元肿瘤队列(G/GNT,71 例)中评估其检测突变的能力。
HGG 队列包括 45 例 IDH 野生型胶质母细胞瘤、32 例 IDH 突变型星形细胞瘤(其中 10 例高级别)、28 例 H3 和 IDH 野生型弥漫性儿童型高级别胶质瘤(其中 14 例 pedHGG-RTK1A)、4 例 3 级多形性黄色星形细胞瘤、3 例 H3 G34 突变型弥漫性大脑半球胶质瘤,以及 2 例 E 亚型高级别胶质瘤。G/GNT 队列包括 20 例毛细胞型星形细胞瘤、10 例胚胎发育不良性神经上皮肿瘤、9 例节细胞胶质瘤、9 例弥漫性软脑膜胶质神经元肿瘤、6 例 2 级多形性黄色星形细胞瘤、5 例 MGNT、5 例 MYBL1 改变型弥漫性星形细胞瘤、4 例形成菊形团的胶质神经元肿瘤和 3 例血管中心性胶质瘤。全部样本均行 DNA 甲基化谱分析。
采用识别受体胞外结构域的 PDGFRA 单克隆抗体 OTI2E9(Thermo Fisher,1:500),在 Omnis 自动染色仪上对 3 μm 厚 FFPE 切片染色。脑实质作阴性对照,已知有 PDGFRA 扩增的胃肠道间质瘤作阳性对照。扩增采用 FISH 及甲基化谱 CNV 检测,突变采用 NGS;均在同一遗传检测平台完成。扩增定义为:FISH 下至少 10% 肿瘤细胞该位点超过 8 拷贝[5],和/或 CNV 分析的 log rank ratio >0.8。免疫组化结合强度(0 无、1 弱、2 中等、3 强)和阳性肿瘤细胞百分比评价,胞质和/或胞膜染色均计入。比较两种阈值:方法 1 为至少 50% 细胞强阳性[6];方法 2 为至少 10% 肿瘤细胞强阳性,与 FISH 扩增判定的细胞比例阈值对应。
HGG 队列中,27/114 例有 PDGFRA 扩增:pedRTK1A 为 9/14,IDH 突变型高级别星形细胞瘤为 5/10,IDH 野生型胶质母细胞瘤为 11/45,另有 1 例 HGG-E 和 1 例 H3/IDH 野生型儿童型 HGG A 亚型。10 例为局限于部分肿瘤细胞的克隆性扩增。方法 1、2 分别检出 15 例(13%)和 37 例(32%)免疫阳性,其中分别有 14 例(93%)和 27 例(73%)存在扩增(图 1A–F、表 S1)。全部阳性样本同时显示胞质及胞膜染色。原文随后报告:16 例两种方法均阳性,77 例均阴性,并与 CNV/FISH 结果一致;21 例两种方法结果不一致,其中方法 2 阳性而方法 1 阴性者为 12 例。这提示 10% 肿瘤细胞强染色即可检出扩增。方法 1 的敏感度和特异度为 54% 和 99%,方法 2 为 100% 和 89%。按方法 2,有 10 例免疫阳性病例仅存在拷贝数增加(最多 6 拷贝),其中 3 例伴 PDGFRA 突变。克隆性扩增病例均可被 FISH 检出,但仅 4 例在 CNV 中可见;免疫阳性局限于扩增的细胞成分(图 1G–I)。
原文数据说明:本段关于两种评分法阳性数及不一致数的陈述存在内部不一致;此处保留作者报告的数值,不据此重算或改写结果。
图 1.
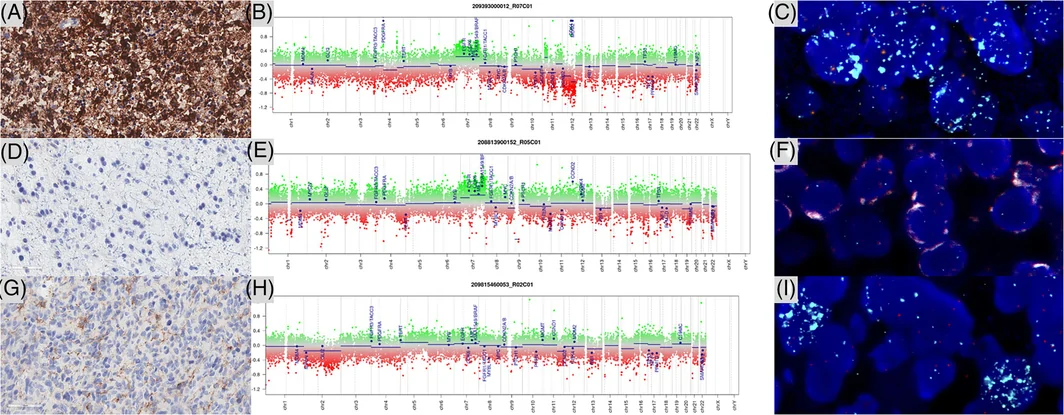
在 G/GNT 队列中,PDGFRA 突变仅见于 MGNT。整个队列没有达到阳性评分阈值的病例。11 例肿瘤有弱至中等染色,其中仅 3 例为 MGNT(图 S1、表 S1)。因此,两种方法检测 PDGFRA 突变的敏感度均为 0%,特异度均为 100%。
总体而言,PDGFRA 免疫组化是快速、低成本且节省组织的扩增筛查方法,但不能检测突变。成人 IDH 突变型星形细胞瘤的分级可能受取样限制,如活检取自强化区以外或细胞含量低;此外,2 级与 3 级之间的核分裂阈值很低(每 2.4 mm² 3 个核分裂象)。在这些情况下,免疫组化可成为识别扩增的稳健手段,特别适用于浸润性胶质瘤,并可与 FISH 一起识别瘤内异质性及克隆性扩增。本研究表明,经过充分校准并监测阳性、阴性对照的 PDGFRA 免疫组化有助于发现扩增。只计算强胞膜和/或胞质染色更具有预测性,因为拷贝数增加或突变病例可出现弱至中等染色。不过,一些没有扩增、只有拷贝数增加的肿瘤也会阳性,故免疫组化应定位为筛查,随后用其他技术确认扩增。可提出如下流程:超过 10% 肿瘤细胞强染色时高度怀疑 PDGFRA 扩增;局灶强染色但不足 10% 时,在作出结论之前必须进行 FISH 或其他遗传检测。
本组病例还说明,这一方案可能检不出突变,因此不适合作为 G/GNT 的诊断工具。新的评分方法需要像常规 HER2 染色一样,为各级染色评分设置明确定义的阴性和阳性对照。
总之,PDGFRA 免疫组化应纳入神经病理医生的常规抗体组合,用于筛查具有 PDGFRA 位点扩增的胶质瘤。
作者贡献与利益冲突
ATE 和 GA 解读免疫组化数据、建立队列并起草稿件;AM、LH、FS 和 PV 协助修改;全体作者审阅文章。作者声明无利益冲突。
补充材料
图 S1 为 MGNT 的 PDGFRA 免疫染色实例:A 为弥漫中等强度染色,B 为无染色,均 400×,比例尺 60 μm。表 S1 列出各队列详细免疫组化和遗传结果。补充文件见下方原文入口;正文没有独立数据表。
Abstract
PDGFRA gene amplification is now recognized as a diagnostically and prognostically relevant molecular alteration in central nervous system tumors. Herein, we demonstrated that PDGFRA immunohistochemistry is a highly specific and sensitive biomarker for identifying PDGFRA amplification and should be part of the neuropathologist's routine panel of antibodies.
PDGFRA gene amplification is now recognized as a diagnostically and prognostically relevant molecular alteration in central nervous system tumors. Indeed, it has been recently introduced as an adverse hallmark in astrocytoma, isocitrate dehydrogenase (IDH)‐mutant, with its presence being sufficient for grade 4 designation [1]. It has also been reported as a frequent alteration in diffuse pediatric high‐grade glioma (HGG), IDH‐wildtype (IDH‐WT) and H3‐wildtype (H3‐WT), particularly in the RTK1 subgroup [2, 3]. Additionally, PDGFRA mutation has also been reported as a diagnostic marker of myxoid glioneuronal tumor (MGNT) [4]. Several methods are routinely used to identify PDGFRA alterations: fluorescent in situ hybridization (FISH), next‐generation sequencing (NGS), comparative genomic hybridization (CGH)‐ and single nucleotide polymorphism (SNP)‐array, and more recently, copy number variation (CNV) from DNA‐methylation analysis. In an increasingly complex diagnostic spectrum, neuropathologists can rely on accessible routine diagnostic tools to detect these alterations. In this context, we evaluated the sensitivity and specificity of immunohistochemistry (IHC) for the detection of a PDGFRA amplification in a methylation‐based cohort of HGG (n = 114), and for the detection of a PDGFRA mutation in a methylation‐based cohort of glial and glioneuronal tumors (G/GNT, n = 71), where the PDGFRA status was known.
The cohort of HGG included: 45 glioblastomas, IDH‐WT; 32 astrocytomas, IDH‐mutant (A‐IDH, including 10 high‐grades); 28 diffuse pediatric‐type HGGs (pedHGG), H3‐WT and IDH‐WT (including 14 pedHGG‐RTK1A); 4 pleomorphic xanthoastrocytomas (grade 3); 3 diffuse hemispheric gliomas, H3 G34‐mutant; and 2 HGGs, subtype E (HGG‐E). The cohort of G/GNT included: 20 pilocytic astrocytomas, 10 dysembryoplastic neuroepithelial tumors, 9 gangliogliomas, 9 diffuse leptomeningeal glioneuronal tumors, 6 pleomorphic xanthoastrocytomas (grade 2), 5 MGNT, 5 diffuse astrocytomas, MYBL1‐altered, 4 rosette‐forming glioneuronal tumors, and 3 angiocentric gliomas. For all the samples, a DNA‐methylation profiling analysis was performed.
We used the PDGFRA antibody (monoclonal, clone OTI2E9; 1:500 dilution; Thermo Fisher; Waltham, USA), targeting the extracellular domain of the receptor, on 3‐μm‐thick sections of formalin‐fixed, paraffin‐embedded tissue samples, performed by an Omnis automate. The following controls were used: cerebral parenchyma (as a negative control) and a gastrointestinal stromal tumor known to have a PDGFRA amplification (as a positive control). Tumoral molecular analysis of PDGFRA was conducted using FISH and CNV from DNA‐methylation profiling analyses (for the detection of amplification), and NGS analysis (for the detection of mutations). These methods were carried out on the same genetics platform. Amplification was defined as more than eight copies of the locus in at least 10% of tumor cells for FISH, as previously reported [5] and/or a log rank ratio >0.8 on CNV analysis. PDGFRA IHC was quantified using two methods based on the intensity of the staining (0: absent; 1: weak; 2: moderate; 3: strong) and the percentage of immunopositive tumor cells. A cytoplasmic and/or membranous staining was considered. Two cut‐offs of immunopositivity were evaluated and defined as method 1/≥50% positive cells with a strong staining as previously published [6], or method 2/if at least 10% of the tumor cells presented a strong immunoreactivity in correlation with the cut‐off used for the amplification detected by FISH.
In the HGG cohort, a PDGFRA amplification was detected in 27/114 samples, frequently observed in pedRTK1A (9/14), and high‐grade astrocytomas, IDH‐mutant (5/10), but also in glioblastomas, IDH‐WT (11/45) and other entities (one HGG‐E and one pedHGG, H3 and IDH‐WT, subtype A). In 10 samples, the amplification was clonal, observed in a subset of tumor cells. A positive IHC score was present in 15 (13%) and 37 samples (32%) respectively, using scoring methods 1 and 2, respectively, with 14 (93%) and 27 (73%) of them harboring a PDGFRA amplification (Figure 1A–F and Table S1). All positive samples presented both cytoplasmic and membranous staining. IHC results were positive by both methods in 16 samples and negative by both methods in 77 cases, concordant with CNV/FISH results. For 21 samples, IHC results were discordant between the two methods: method 2 was positive while method 1 was negative (n = 12), highlighting the fact that 10% of tumor cells with strong staining (positive result for method 2 but negative for method 1) was sufficient to detect amplification. Thus, the sensitivity and specificity of PDGFRA IHC for the detection of PDGFRA amplification was 54% and 99% using method 1, and 100% and 89% using method 2. Based on method 2, 10 cases were considered as immunopositive and presented a gain (up to 6 copies of the locus), with a concomitant PDGFRA mutation identified in three cases. In tumors with clonal amplification (all detectable using FISH, and only four of them visible on CNV), IHC positivity was restricted to the amplified component (Figure 1G–I).
Figure 1.
In the G/GNT cohort, a PDGFRA mutation was only observed in MGNT. No positive IHC score was present in the entire cohort. A positive staining (with a weak to moderate intensity) was present in 11 tumors, including only three MGNT (Figure S1 and Table S1). Thus, the sensitivity and specificity of PDGFRA IHC for the detection of PDGFRA mutation were 0% and 100% for both methods.
Overall, PDGFRA IHC constitutes a fast, low‐cost, and tissue‐conserving method for detecting PDGFRA amplification, but not mutations. In adults, the grading of astrocytomas, IDH‐mutant can be challenging because of sampling (biopsies made outside the tumor enhancement or biopsies presenting low cellular rates), but also because the cut‐off distinguishing grade 2 from grade 3 is low (three mitoses for 2.4 mm2). Under these conditions, IHC may constitute a robust technique for identifying the amplification, particularly in infiltrative gliomas. Moreover, IHC may help diagnose, alongside FISH analysis, the presence of intratumoral heterogeneity or clonal amplification. The current work demonstrates that a well‐calibrated PDGFRA IHC (with monitoring of positive and negative controls) may facilitate the identification of PDGFRA amplification. Scoring based exclusively on strong membranous and/or cytoplasmic immunoreactivity appears to be the more predictive method for detecting amplification because weak to moderate staining may be observed in cases of gain or mutation. However, because some tumors may show positive staining without amplification (only a gain), the IHC should be considered a screening tool, with amplification confirmed secondarily by another technique. In light of all these results, the following algorithm can be proposed: cases in which more than 10% of tumor cells show intense staining are strongly suspected of having a PDGFRA amplification. For cases with intense focal staining (less than 10%), genetic testing (FISH or other methods) is required before any conclusions can be drawn.
The present series also indicates that this protocol may not detect mutations, and thus does not represent a suitable diagnostic tool for G/GNT. This new scoring method requires well‐defined negative and positive controls for each staining score, as is routinely done for HER2 staining.
To conclude, PDGFRA IHC should be included in the neuropathologist's routine panel of antibodies to screen for gliomas harboring PDGFRA locus amplification.
AUTHOR CONTRIBUTIONS
ATE and GA conducted the interpretation of the immunohistochemical data analysis, and drafted the manuscript. ATE and GA generated the cohort, AM, LH, FS and PV helped in the revision of the manuscript. All authors reviewed the article.
CONFLICT OF INTEREST STATEMENT
The authors declare no conflicts of interest.
Supporting information
Figure S1. PDGFRA immunostaining in examples of myxoid glioneuronal tumors. Diffuse and moderate staining for PDGFRA (A, magnification, 400×). No staining for PDGFRA (B, magnification, 400×). Scale bars represent 60 μm.
Table S1. Detailed immunohistochemical and genetic results of the cohorts.
ACKNOWLEDGMENTS
We would like to thank the laboratory technicians at GHU Paris Neurosciences, Hospital Sainte‐Anne, for their assistance.
DATA AVAILABILITY STATEMENT
The datasets used and/or analyzed during the current study are available from the corresponding author upon reasonable request.
References
- 1 Brat DJ , Aldape K , French PJ , Louis DN , Nasrallah MP , Reifenberger G , et al. cIMPACT‐NOW update 12: refining pathology‐based risk stratification and grading for IDH‐mutant gliomas. Neuro‐Oncol. 2026;18:noag108. 10.1093/neuonc/noag108 42152226
- 2 Deng MY , Sturm D , Pfaff E , Sill M , Stichel D , Balasubramanian GP , et al. Radiation‐induced gliomas represent H3‐/IDH‐wild type pediatric gliomas with recurrent PDGFRA amplification and loss of CDKN2A/B. Nat Commun. 2021;12(1):5530. 10.1038/s41467-021-25708-y 34545083 PMC8452680
- 3 DeSisto J , Lucas JT , Xu K , Donson A , Lin T , Sanford B , et al. Comprehensive molecular characterization of pediatric radiation‐induced high‐grade glioma. Nat Commun. 2021;12(1):5531. 10.1038/s41467-021-25709-x 34545084 PMC8452624
- 4 Solomon DA , Korshunov A , Sill M , Jones DTW , Kool M , Pfister SM , et al. Myxoid glioneuronal tumor of the septum pellucidum and lateral ventricle is defined by a recurrent PDGFRA p.K385 mutation and DNT‐like methylation profile. Acta Neuropathol. 2018;136(2):339–343. 10.1007/s00401-018-1883-2 30006677 PMC7787982
- 5 Tauziède‐Espariat A , Saffroy R , Pagès M , Pallud J , Legrand L , Besnard A , et al. Cerebellar high‐grade gliomas do not present the same molecular alterations as supratentorial high‐grade gliomas and may show histone H3 gene mutations. Clin Neuropathol. 2018;37(5):209–216. 10.5414/NP301104 29809131
- 6 Pirker R , Pereira JR , von Pawel J , Krzakowski M , Ramlau R , Park K , et al. EGFR expression as a predictor of survival for first‐line chemotherapy plus cetuximab in patients with advanced non‐small‐cell lung cancer: analysis of data from the phase 3 FLEX study. Lancet Oncol. 2012;13(1):33–42. 10.1016/S1470-2045(11)70318-7 22056021