- 92 例脑膜瘤比较 CDKN2A/B HD 的 FISH 阈值;各阈值均与更短疾病特异性生存相关,≥20% 尤具提示意义。
- MTAP、p16 IHC 单用或联合均不足以独立替代分子检测,但可帮助选择异质性肿瘤的送检区域。
- 本页为 PMC OA 全文中英双语(PMC13545683)。
1 引言
脑膜瘤是最常见的原发颅内肿瘤,占全部 CNS 肿瘤 42.6%、非恶性病变 57.4%[1],临床行为从缓和到侵袭性不等[2]。WHO CNS 第 5 版(2021)将其分为多种组织亚型和三个恶性等级,与复发及生存相关[2]。但组织学分级存在明显观察者间差异,因此日益依赖分子病理改善预后分层和治疗决策[3]。
9p21 的 CDKN2A/B 纯合缺失(HD)及 TERT 启动子突变是强不良预后指标[4–7],现已成为 CNS WHO 3 级脑膜瘤的独立诊断标准[2]。cIMPACT-NOW 另提出,单体 22 或 NF2 改变背景中的 1p 缺失等可帮助细化 2 级分类[3],因此分子分析对分类和管理至关重要。
CDKN2A/B 缺失造成抑癌蛋白 p16INK4a、p14ARF 丢失,促进细胞周期失调[8]。近期多中心研究再次在多变量分析中验证 CDKN2A/B HD 的预后价值,而 TERT 启动子状态未保留独立显著性[9]。甲基化谱可同时给出类别和 CNV,但成本、可及性受限;FISH 仍是 CNV 参考方法,却耗时且非普遍可及。因而研究者关注 p16 等免疫替代标志[10]。不过,低级别脑膜瘤常不表达 p16,各研究性能不一[11–15]。邻近 CDKN2A/B 的 MTAP 常共同缺失,已有研究提示其免疫缺失与 HD 高度一致[12–14,16],但多数样本小,MTAP 与 p16 的比较仍不清楚。本研究旨在确定 FISH 的最佳 HD 细胞比例阈值,并比较 WHO 1–3 级脑膜瘤中两种免疫标志的替代价值。
2 材料与方法
2.1 病例选择
从意大利都灵 Città della Salute e della Scienza 医院及佛罗伦萨 Careggi 大学医院调取 2006–2021 年手术、组织材料及临床资料充分的 WHO 1–3 级脑膜瘤。为保证随访,未纳入更近病例。选择代表性 FFPE 标本,按 WHO CNS 2021 复核;随后随机纳入能代表各级的病例,并因 3 级 HD 较常见而优先收集,使 1、2、3 级比例为 1:1:2。分级采用既往研究及其他 CNS 肿瘤使用的 FISH HD 细胞 ≥30% 阈值[17](表 S1)。年龄、性别、部位和随访由病历录入专门数据库。
2.2 CDKN2A/B FISH
依 H&E 选择高细胞密度、较高核分裂、坏死等提示更强侵袭性的区域,并避免组织伪影。4 μm 切片用 Zytolight SPEC CDKN2A/CEN9 双色探针(Zytovision,德国 Bremerhaven),按说明书在 HyBrite(Abbott Molecular)杂交,以 Leica GSL120 及 ZEISS Axio Imager Z1 分析。每例至少选 10 个代表区,63× 自动采图,计数 100 个不重叠细胞核[17,18]。正常为 2 个 CDKN2A/B、2 个着丝粒信号;杂合缺失(HetD)为缺失 1 个位点拷贝、保留 2 个着丝粒信号;HD 为两个位点拷贝均缺失,保留 1 或 2 个着丝粒信号。仅有 1 个着丝粒信号时,需结合核形态及图像质量避免伪影。
2.3 免疫组化
同一蜡块切 3 μm 切片,在 Ventana BenchMark AutoStainer 上用 MTAP 单克隆抗体 2G4(Abnova,1:150)及预稀释 CINtec p16 Histology(Ventana)染色。MTAP 保留指胞质表达,可伴核染色;缺失指肿瘤胞质无表达,以内皮作阳性内对照。p16 核和/或胞质定位均算阳性。阳性细胞 <10% 定义为免疫阴性。联合使用时,任一标志 <10% 即判联合阴性。评估局限于与 FISH 相同区域,并与 FISH 时切取的 H&E 比较,排除组织消耗导致的明显变化。
2.4 统计分析
使用 Stata/MP 18.0、SPSS(IBM)和 GraphPad Prism 9.0。连续变量用均值、标准差,分类变量用频数;免疫与 FISH 用 χ² 及 Cohen κ 比较。疾病特异生存(DSS)自诊断至死亡,或在末次随访删失;中位随访用反向 Kaplan–Meier 法。结局分为死于本病(DOD)、死于其他原因(DOC)、带瘤生存(AWD)、无瘤生存(NED),仅 DOD 为 DSS 事件。Kaplan–Meier 绘图、log-rank 比较,Cox 回归计算 HR 和 95% CI。
采用 Aalen–Johansen 法处理无复发死亡等竞争风险,估计疾病特异死亡累积发生率[18]。按 HD/非 HD 及年龄 <55、55–69、≥70 岁分层,Greenwood 方差计算逐点 95% CI。各年龄层用 log-rank 比较,Mantel–Haenszel 年龄分层 log-rank 给出总体比较;随访仍用反向 Kaplan–Meier 估计。
3 结果
3.1 基线
共 92 例,女性 50(54.3%)、男性 42(45.7%),中位年龄 67 岁(19–85),中位随访 69.3 个月(0.1–214.2)。1 级 23 例(25%),2 级 23 例(25%),3 级 46 例(50%)。
3.2 FISH 阈值
分级虽使用 ≥30%,分析另比较 ≥10%、≥20%、≥30% 三阈值。≥10% 时 HD 为 17/92(18.5%):1 级 1/23(4.3%),2 级 5/23(21.7%),3 级 11/46(23.9%),p=0.126。≥20% 时为 6/92(6.5%):3 级 5/46(10.8%),2 级 1/23(4.3%),p=0.304。≥30% 时仅 4/92(4.3%),均为 3 级(4/46,8.7%),p=0.175。
3.3 CDKN2A/B 与疾病特异生存
截至 2025 年 8 月,53/92(57.6%)存活,39/92(42.4%)死于本病;死亡者的中位 DSS 为 18.4 个月(0.9–146.2)。只将本病死亡计为事件。HD≥20% 及 ≥30% 的患者均死于本病,其中位生存分别为 17.4、26.3 个月,存活者均属相应阈值非 HD(p=0.003、0.029)。HD≥10% 的 17 例中,5 例(29.4%)仍存活(p=0.009)。
仅在死亡者中比较,≥10% 的 HD 对非 HD 中位 DSS 为 15.4(1.9–74.8)对 18.4(0.9–146.2)个月,p=0.31;≥20% 为 17.4(1.9–74.8)对 18.4(0.9–146.2),p=0.61;≥30% 为 26.3(1.9–74.8)对 18.4(0.9–146.2),p=0.68。尽管上述中位数比较不显著,log-rank 分析三个阈值均与更短 DSS 显著相关,p 分别 0.001、0.0001、0.043(图 1、S1)。
中位随访 69.3 个月时,Aalen–Johansen 估计在 144 个月的疾病特异死亡累积发生率:HD≥30% 且 55–69 岁组为 100%(95% CI 100–100;3 例、3 事件),≥70 岁组亦 100%(同 CI;1 例、1 事件);<55 岁无 HD,无法估计。非 HD 中,<55 岁为 14.0%(95% CI 5.2–37.6;20 例、4 事件),55–69 岁为 43.8%(26.1–66.5;30 例、13 事件),≥70 岁为 72.0%(54.6–87.4;38 例、18 事件)。
年龄层内比较,≥70 岁的 HD 与非 HD 差异显著(χ²=7.68,p=0.006),55–69 岁不显著(χ²=0.23,p=0.63),年轻组无 HD,无法比较。合并年龄层的分层 log-rank 总体不显著(χ²=1.49,p=0.22),但提示老年 HD 者 DSS 更差的趋势(图 2)。
正文报告单变量 Cox:年龄 HR 2.6(95% CI 1.13–6.03,p=0.025),高级别 HR 17.1(5.24–55.8,p<0.001),HD≥10% HR 3.05(1.52–6.14,p=0.002),≥20% HR 4.73(1.96–11.45,p=0.001),≥30% HR 4.06(1.43–11.52,p=0.009),均与不良生存相关。原文表 1 的 HR、CI、p 数值与本段不同;下方保留原表,不擅自统一。
3.4 免疫组化与 FISH
两位病理医生独立评估,有分歧时共同复核达成一致。染色覆盖全切片,但关联分析仅使用与 FISH 空间对应的区域。总体 MTAP 阴性 11/92(11.9%),p16 阴性 35/92(38%)。HD≥10% 的 17 例中,MTAP 阴性 5(29.4%;p=0.014,敏感度 29.41%,特异度 92%),p16 阴性 7(41.2%;p=0.768,敏感度 41.2%,特异度 62.7%)。HD≥20% 的 6 例中,两者各阴性 3 例(50%),MTAP p=0.021、敏感度 50%、特异度 90.7%;p16 p=0.670、敏感度 50%、特异度 62.8%。HD≥30% 的 4 例中,MTAP 阴性 2(50%;p=0.069,敏感度 50%、特异度 89.8%),p16 阴性 3(75%;p=0.152,敏感度 75%、特异度 63.6%)。对应形态见图 3。
任一标志阴性作为联合阴性时,≥10% 阈值检出 10/17(58.8%;p=0.227,敏感度 58.8%、特异度 57.3%);≥20% 检出 5/6(83.3%;p=0.089,敏感度 83.3%、特异度 57%);≥30% 检出 4/4(p=0.040,敏感度 100%、特异度 56.8%)。两标志染色仅 54/92(58.7%)一致,κ=−0.010,未超过偶然一致。表 2 的部分 p 值与正文不同,均按原文分别保留。
表 1. TABLE 1
| HR | CI | p | ||
|---|---|---|---|---|
| Age | Linear | 2.7 | 1.16–6.23 | 0.021 |
| Sex | M vs. F | 1.14 | 0.61–2.14 | 0.687 |
| CDKN2A/B HD | ≥ 10% | 2.8 | 1.41–5.62 | 0.003 |
| ≥ 20% | 3.73 | 1.54–9.05 | 0.004 | |
| ≥ 30% | 3.01 | 1.05–8.67 | 0.041 | |
| Grade | 1/2 vs. 3 | 16.3 | 4.99–53.1 | < 0.001 |
| MTAP | < 10% | 1.51 | 0.63–3.64 | 0.355 |
| p16 | < 10% | 0.81 | 0.42–1.58 | 0.541 |
| MTAP/p16 | < 10% | 0.84 | 0.44–1.59 | 0.591 |
表 2. TABLE 2
| CDKN2A/B HD cutoff | Sensitivity | Specificity | p | |
|---|---|---|---|---|
| MTAP | ≥ 10% | 29.41% | 92% | 0.014 |
| ≥ 20% | 50% | 90.7% | 0.003 | |
| ≥ 30% | 50% | 89.8% | 0.016 | |
| p16 | ≥ 10% | 41.18% | 62.7% | 0.768 |
| ≥ 20% | 50% | 62.8% | 0.533 | |
| ≥ 30% | 75% | 63.6% | 0.120 | |
| MTAP/p16 | ≥ 10% | 58.8% | 57.3% | 0.227 |
| ≥ 20% | 83.3% | 57% | 0.055 | |
| ≥ 30% | 100% | 56.8% | 0.026 |
3.5 免疫标志与生存
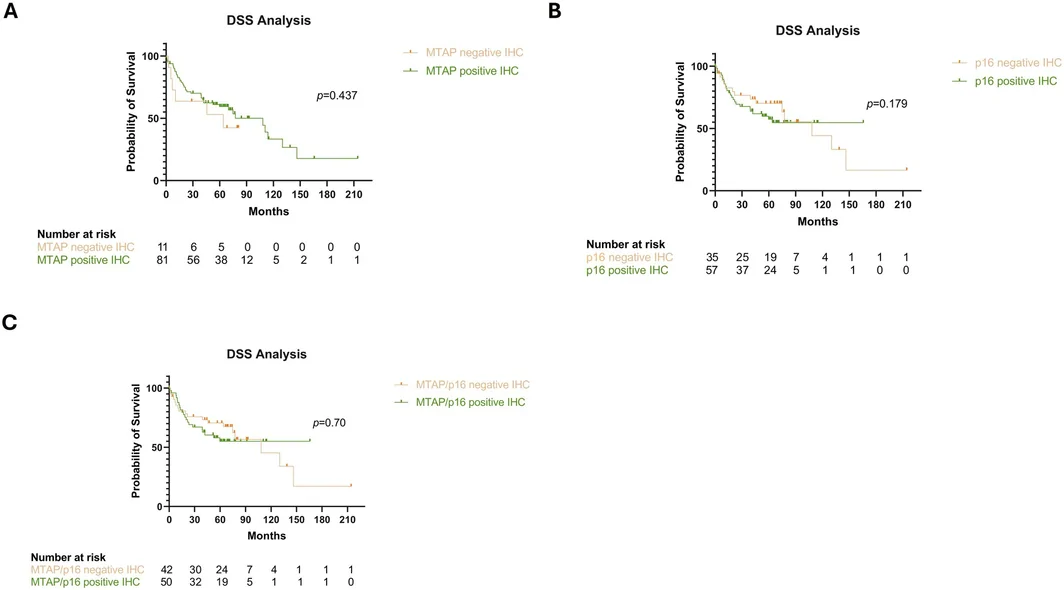
39 位本病死亡者中,MTAP 阴性 6(15.4%,p=0.385),p16 阴性 15(38.5%,p=0.944),联合阴性 18(46.2%,p=0.934)。免疫阳性对阴性的中位 DSS:MTAP 为 21.6(0.9–146.2)对 8.7(2.6–64)个月,p=0.97;p16 为 16.1(1.4–64)对 21.6(0.9–146.2),p=0.17;联合为 16.9(1.4–59.7)对 20.5(0.9–146.2),p=0.97。单独或联合均与 DSS 无显著 log-rank 关联(MTAP p=0.437;p16 p=0.179;联合 p=0.70;图 4),单变量 Cox 也不显著(表 1)。
3.6 空间异质性
5 例免疫染色明显异质者在同一蜡块两个区域重复 FISH(图 S2)。选区依据为 MTAP 或 p16 区域染色强度差 >20%;3 例按 p16、1 例按 MTAP、1 例两者均异质。TO3、TO15 两区 HD 状态明显不同,与 p16 较一致,而与 MTAP 不一致。
图 1.
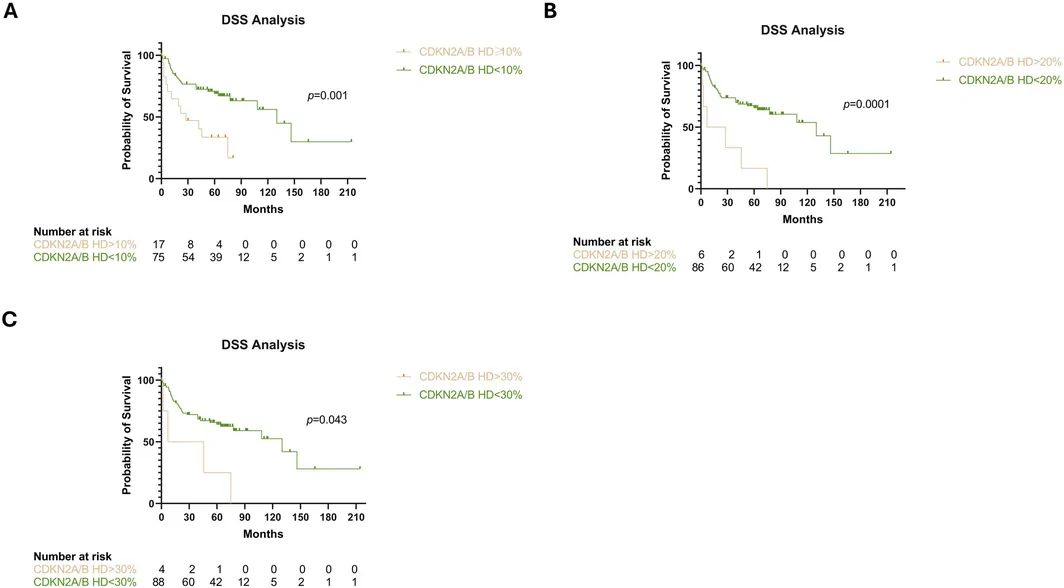
图 2.
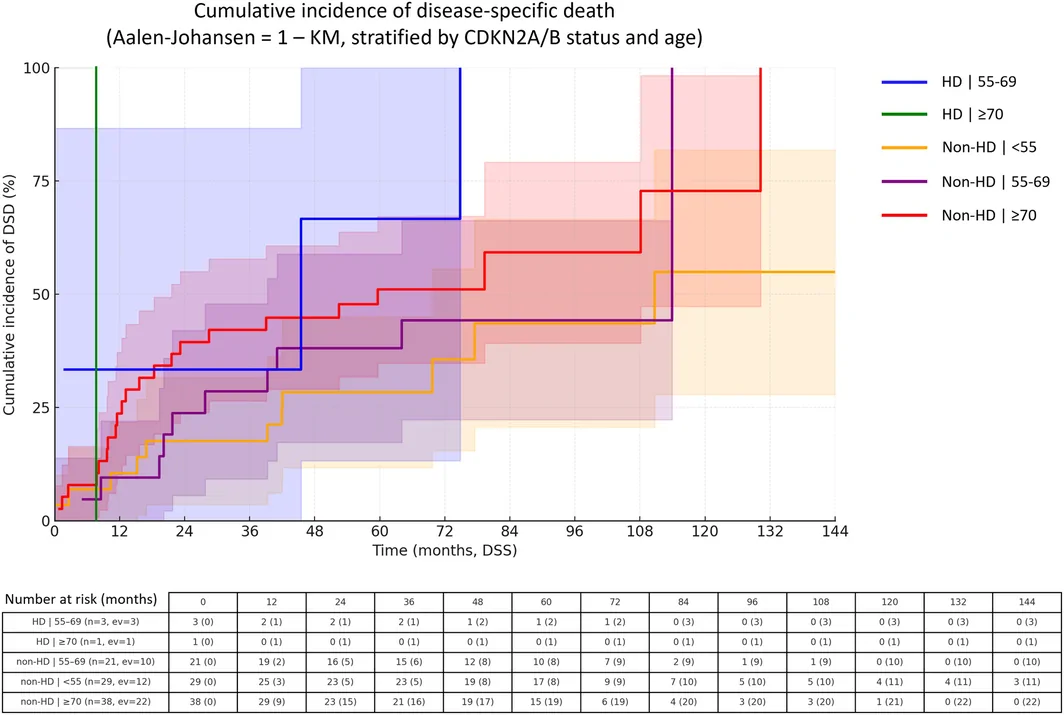
图 3.
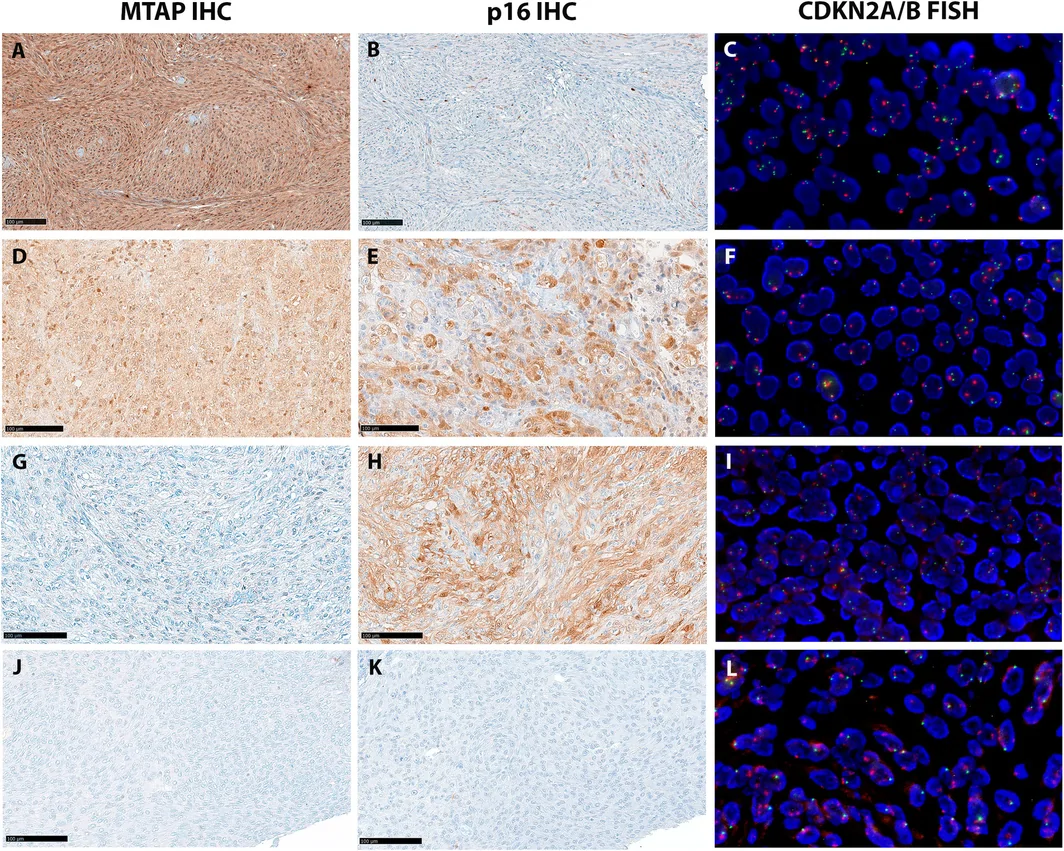
图 4.
4 讨论
本研究在较大脑膜瘤队列中比较 CDKN2A/B HD 阈值。缺失是不良 DSS 标志,尤其 ≥20% 时,支持其作为侵袭性行为的强预后指标;MTAP、p16 与分子状态一致性不稳定,不能可靠预测生存,显示免疫替代方法的局限。
新 WHO 分类使准确识别不良分子谱更重要。HD 的不良作用已在多个大队列验证,但多数用甲基化或 NGS;FISH 及经验证阈值的数据仍少且不一致[13,14,19]。因此本文逐级比较 ≥10%、≥20%、≥30%。全部阈值与不良结局相关,即使最高阈值病例少亦如此。作者在讨论中概述 HD≥20% 者约诊断后两年内均死亡,支持该改变的临床影响[5,6];具体生存范围仍应以结果节为准。Li 等发现 23% 最能提高 FISH 与 NGS 一致性,与本研究相近[20]。≥70 岁且 HD≥30% 的疾病特异死亡更高,提示年龄依赖影响。为减少截断核及信号丢失造成的技术噪声,作者建议采用较严格阈值,如 ≥30%,与其他 CNS 肿瘤建议一致[17]。
可靠免疫替代标志可显著方便常规诊断,但既往 p16、MTAP 结果不一致[11–13,15,16,19,21,22]。p16 缺失可常见于 1、2 级[15],部分研究在恶性肿瘤中报告高敏感度、特异度,但 HD 阳性高级别病例少[11]。一些研究认为 MTAP 特异度优于 p16,可独立替代[13,14];另一些反对单用[19]。
本组 MTAP 特异度较高(89.8%–92%),敏感度有限(29.4%–50%);p16 敏感度 41.2%–75%,特异度 62.7%–63.6%。p16 可因非基因缺失机制丢失[12,13],低级别基线表达尤低[19];MTAP 缺失更特异,但可能漏掉未累及 MTAP 位点的部分或异质性改变[13,16]。联合增加敏感度(58.8%–100%),却明显牺牲特异度;原文讨论给出 56.0%–57.3%,表 2 实际列 56.8%–57.3%,两者分别保留。总体准确性未改善。
瘤内异质性进一步复杂化解读。既往报道亚克隆 CDKN2A/B、MTAP 缺失与区域染色差异[19],符合脑膜瘤已知空间遗传异质性[23–25]。本研究不同区域复核发现免疫与 FISH 关联可变,少数病例 p16 部分一致。即使死亡者 MTAP 缺失比例较高,两种标志均未与 DSS 显著关联,不能充分捕捉 HD 赋予的侵袭性,预后应用受限。这与一致性取决于阈值及异质性的既往观察吻合[20]。虽然联合未改善总体诊断性能,仍可指导异质性肿瘤的分子取材[12,13]。
本组 HD 阳性数少,但 ≥30% 阈值发生率与文献 <5% 一致[3,7]。本队列富集 3 级,是迄今较大系列之一,比既往仅 3–15 例 3 级的研究更有基础[11–14,16]。另一个局限是 FISH 为单细胞定量技术,作为参考有技术约束;近期与 NGS 等整体分析方法的高一致性支持其可靠性[20,22]。
结论是 CDKN2A/B HD 具有临床意义的不良预后价值,尤其 ≥20% 时。MTAP、p16 与分子状态关联不稳定,无独立预后价值。MTAP 因较高特异度或有有限用途,但两者均不能代替直接分子检测,可在异质性背景下辅助取材。
作者贡献、资助及伦理
P.C.、L.B. 设计研究;A.A.R.、F.N. 分析并写作;A.A.R. 完成 H&E 和免疫染色;F.N.、A.B. 复核及评估免疫;C.T.、L.V.C. 完成 FISH;D.G.、M.L.、R.R.、C.B.、A.D.P.、L.L.、I.D. 提供临床资料。全体作者批准稿件。L.B. 获 Fondazione Ricerca Molinette ETS、Fondazione CRT(113265/2025.0323)、Rete Oncologica Piemonte e Valle d’Aosta 资助。研究符合都灵大学 IRB 及《赫尔辛基宣言》;佛罗伦萨队列获托斯卡纳伦理委员会批准(27080_BIO)。所有患者同意手术和资料收集,回顾性研究无需另行专门书面同意。作者声明无利益冲突。
补充材料
图 S1 比较全部 HD 阈值的 DSS 曲线;图 S2 展示 TO3、TO15、TO59、TO60、TO74 多区域 FISH/免疫异质性。表 S1 列 3 级分级特征:原文补充说明称 17 例(34%)仅按核分裂数、3 例(6%)仅按明确间变分为 3 级,另 3 例依据分子特征重分级(HD≥30%、TERT 启动子致病突变、二者兼有各 1 例)。补充说明的百分比与正文 46 例 3 级的分母不一致,未作擅自修正。补充文件入口见下方。
Abstract
ABSTRACT
Aims
Homozygous deletion (HD) of CDKN2A/B represents an adverse prognostic biomarker in meningiomas and a diagnostic criterion for CNS WHO grade 3 assignment. However, fluorescence in situ hybridisation (FISH) thresholds and the role of immunohistochemistry (IHC) surrogates remain uncertain. This study evaluated multiple CDKN2A/B FISH cutoffs and assessed the diagnostic and prognostic performance of MTAP and p16 IHC.
Methods and Results
Ninety‐two meningiomas (CNS WHO grades 1–3) were analysed by FISH evaluating ≥ 10%, ≥ 20% and ≥ 30% CDKN2A/B HD thresholds. CDKN2A/B HD was identified in 18.5%, 6.5% and 4.3% of cases using the respective cutoffs and was significantly associated with shorter disease‐specific survival across all thresholds (HD ≥ 10% p = 0.001; HD ≥ 20% p = 0.0001; HD ≥ 30% p = 0.043). Patients with HD ≥ 20% and ≥ 30% experienced universal disease‐specific mortality within a median survival time of approximately 2 years. MTAP and p16 IHC were performed in matched areas. MTAP IHC showed high specificity (90%–92%) but limited sensitivity (30%–50%), while p16 IHC displayed variable sensitivity (41%–75%) and lower specificity (63%). Combined MTAP/p16 negativity improved sensitivity (up to 100%) but reduced specificity (57%). Neither MTAP nor p16 loss correlated significantly with survival. Spatially heterogeneous IHC patterns corresponded to regional variability in CDKN2A/B deletion by FISH.
Conclusions
CDKN2A/B HD detected by FISH, particularly using thresholds equal or greater than 20%, is strongly associated with poor outcome in meningiomas. MTAP and p16 IHC, alone or combined, lack sufficient accuracy as independent surrogates but may guide tissue selection for molecular testing in heterogeneous tumours.
Abbreviations
AWDalive with disease
CNVcopy‐number variation
DOCdead of other causes
DODdead of disease
DSSdisease‐specific survival
FISHfluorescence in situ hybridisation
H&Ehaematoxylin and eosin
HDhomozygous deletion
HetDheterozygous deletion
IHCimmunohistochemistry
NEDno evidence of disease
SDstandard deviation
1 Introduction
Meningiomas represent the most common primary intracranial tumours (42.6% of all CNS tumours and 57.4% of nonmalignant lesions) [1]. Their clinical behaviour is highly heterogeneous, ranging from indolent to aggressive disease [2]. According to the fifth edition of the WHO Classification of the CNS Tumours (CNS WHO 2021), meningiomas are divided into several histological subtypes and graded into three malignancy grades that correlate with recurrence risk and survival [2]. However, histology‐based grading is affected by considerable inter‐observer variability, prompting increasing reliance on molecular pathology to refine prognostic stratification and guide therapeutic decisions [3].
Among molecular biomarkers, homozygous deletion (HD) of the CDKN2A/B locus on chromosome 9p21 and TERT promoter mutations have emerged as strong predictors of poor outcome [4, 5, 6, 7] and are now independent diagnostic criteria for CNS WHO grade 3 meningiomas [2]. Additionally, the cIMPACT‐NOW consortium proposed further molecular criteria to refine CNS WHO grade 2 classification, including 1p deletions in the context of monosomy 22 or NF2 alterations [3]. Consequently, molecular profiling has become pivotal for meningioma classification and management.
CDKN2A/B deletions lead to loss of the tumour suppressors p16 INK4a and p14 ARF , promoting dysregulated cell cycle progression [8]. Notably, a recent multicentre study further validated the prognostic value of CDKN2A/B HD in multivariable analysis, whereas TERT promoter status did not retain independent significance [9]. Accurate detection of CDKN2A/B HD is therefore increasingly relevant in routine diagnostics. Although DNA methylation profiling enables simultaneous assessment of methylation classes and copy‐number variation (CNV), its widespread use is limited by cost and availability. Thus, fluorescence in situ hybridisation (FISH) remains a reference method for CNV detection, but is time‐consuming, costly and not universally accessible. These limitations have driven interest in immunohistochemical (IHC) surrogate markers, especially loss of key tumour suppressor p16 [10]. However, p16 is frequently absent in low‐grade meningiomas, and its diagnostic performance varies across studies [11, 12, 13, 14, 15]. Attention has therefore shifted to MTAP, encoded by a gene adjacent to CDKN2A/B and commonly co‐deleted. Several studies have demonstrated strong concordance between MTAP IHC loss and CDKN2A/B HD in meningiomas [12, 13, 14, 16], although most were limited by small cohort sizes. To date, the comparative diagnostic performance of MTAP and p16 IHC has not been clearly established.
In this study, we aimed to define the optimal FISH cutoff for CDKN2A/B homozygous deletion (i.e., the minimum proportion of tumour cells showing CDKN2A/B HD used to classify a case as homozygously deleted) and to evaluate and compare MTAP and p16 IHC as surrogate markers across CNS WHO grade 1–3 meningiomas, with the goal of improving diagnostic workflows.
2 Materials and Methods
2.1 Case Selection
Initially, all samples from CNS WHO grade 1, 2 and 3 meningiomas resected between 2006 and 2021 with both adequate histological material and matched clinical data were retrieved from the pathology files of the ‘Città della Salute e della Scienza’ Hospital (Turin, Italy) and the Careggi University Hospital (Florence, Italy). More recent samples were not included to ensure adequate follow‐up. Representative formalin‐fixed and paraffin‐embedded (FFPE) tissue samples were selected for each case included in the study and submitted to histopathological review according to CNS WHO 2021 [2]. A series representative in terms of WHO grade was then randomly included in the study and submitted to further analysis, prioritising the collection of CNS WHO grade 3 meningiomas, given the higher frequency of CDKN2A/B HD in this group, yielding a 1:1:2 ratio according to WHO grade 1, 2 and 3 neoplasms, respectively. Cases were graded according to CNS WHO 2021 criteria; for grading purposes, a FISH cutoff value of homozygous deleted cells ≥ 30% was used, in accordance with previous studies, including studies of other CNS tumours (Table S1) [17]. Clinical data such as age at diagnosis, sex, tumour location and follow‐up data were retrieved from patients' clinical reports in a dedicated database.
2.2 CDKN2A/B Locus FISH Analysis
Based on H&E staining, a tumour area was selected for FISH analysis in accordance with routine practice, focusing on areas suggestive of greater aggressiveness (e.g., higher cellularity, higher mitotic activity and presence of necrosis) and with adequate quality (e.g., avoiding tissue artefacts). Sections 4 μm thick were cut and FISH was performed using the Zytolight SPEC CDKN2A/CEN 9 Dual Colour probe (Zytovision, Bremerhaven, Germany) according to the manufacturer's instructions. Hybridisation was performed using a HyBrite (Abbott Molecular Inc., IL, USA) and slides were analysed using the fluorescence microscopes GSL120 Leica (Leica Biosystems Richmond Inc., IL, USA) and Axio Imager Z1 (ZEISS, Oberkochen, Germany). At least 10 representative areas per case were selected and automatically acquired at ×63 magnification, counting 100 nonoverlapping nuclei to determine the following categories in line with previous studies [17, 18]: normal (two CDKN2A/B and two centromeric signals); heterozygous deletion (HetD) (loss of one copy of CDKN2A/B and two centromeric signals); homozygous deletion (HD) (loss of two copies of CDKN2A/B and one or two centromeric signals; when only one centromeric signal was present, attention was paid to the overall nuclear morphology and image quality to minimise the risk of potential artefacts).
2.3 Immunohistochemistry
Sections 3 μm thick were cut from the same FFPE tissue block used for CDKN2A/B FISH analysis for each case. IHC was performed on the automated platform Ventana BenchMark AutoStainer (Ventana Medical Systems, AZ, USA) according to the manufacturer's instructions with the following primary antibodies: MTAP (monoclonal antibody, clone 2G4, diluted 1:150; Abnova, Taipei City, Taiwan) and CINtec p16 Histology (monoclonal antibody, prediluted; Ventana Medical Systems, AZ, USA). MTAP retention was defined as cytoplasmic expression with or without nuclear staining in tumour cells, and MTAP loss as the absence of cytoplasmic expression in tumour cells with endothelial cells serving as a positive internal control. p16 antibody staining was considered positive for nuclear and/or cytoplasmic localisation. A cutoff of < 10% positive cells was used to define samples as negative by IHC. When used in combination, staining with < 10% positive cells for at least one marker was considered sufficient to classify the sample as negative. Of note, IHC staining was evaluated in the same areas analysed by FISH and IHC slides were compared with the H&E section cut at the time of FISH analysis to exclude significant changes due to sample consumption which could contribute to discrepant results.
2.4 Statistical Analysis
All analyses were performed using Stata/MP 18.0 statistical software (STATA, College Station, TX, USA), SPSS Inc. (IBM, Chicago, IL, USA) and Prism GraphPad 9.0 (GraphPad Software, San Diego, CA, USA). Continuous variables were summarised as the mean and standard deviation (SD), whereas categorical variables were reported as frequencies. IHC and FISH results were compared using the chi‐square test and Cohen's kappa coefficient for categorical variables. Disease‐specific survival (DSS) was calculated from the date of diagnosis to the date of death, if available, or censored at date of last follow‐up. Median follow‐up was estimated according to the reverse Kaplan–Meier method. Patients' outcomes were categorised as dead of disease (DOD), dead of other causes (DOC), alive with disease (AWD) or no evidence of disease (NED), and only deaths attributable to the disease (DOD) were considered as events for DSS analysis. Survival curves between different groups were plotted using the Kaplan–Meier method, and the statistical comparisons were performed using the log‐rank test. Cox regression analyses were conducted on DSS to calculate HRs and 95% CIs for the different study groups. DSS was then assessed using the Aalen–Johansen method to appropriately account for competing risks—such as death without recurrence—providing an unbiased estimate of the cumulative incidence of disease‐specific death, as previously published [18]. Cumulative incidence functions (CIFs) were computed according to CDKN2A/B status (homozygous deletion [HD] vs. nonhomozygous deletion [non‐HD]) and further stratified by age (< 55, 55–69 and ≥ 70 years). Pointwise 95% confidence intervals (95% CIs) were derived via Greenwood's variance. Log‐rank tests were used to compare groups within age strata, and a Mantel–Haenszel age‐stratified log‐rank test provided the overall comparison of HD versus non‐HD tumours. Median follow‐up was estimated using the reverse Kaplan–Meier method.
3 Results
3.1 Patients' Baseline Characteristics
Ninety‐two patients diagnosed with CNS WHO grade 1, 2 and 3 meningiomas were included in this study. Fifty of 92 patients (54.3%) were female and 42 (45.7%) were male; the median age was 67 years (range 19–85), and the median follow‐up was 69.3 months (range 0.1–214.2). The cohort was stratified as follows: 23/92 (25%) CNS WHO grade 1 meningiomas, 23/92 (25%) CNS WHO grade 2 meningiomas and 46/92 (50%) CNS WHO grade 3 meningiomas.
3.2 CDKN2A/B HD FISH Analysis
As reported in the Methods section, even though a CDKN2A/B homozygous deletion FISH cutoff of ≥ 30% was used for WHO grading purposes, different cutoff values of ≥ 10%, ≥ 20% and ≥ 30% deleted cells were assessed by FISH as potential thresholds to define a sample as homozygous deleted. According to the 10% cutoff, 17/92 (18.5%) cases were HD for CDKN2A/B, specifically, 1/23 (4.3%) CNS WHO grade 1 meningioma, 5/23 (21.7%) CNS WHO grade 2 meningiomas and 11/46 (23.9%) CNS WHO grade 3 meningiomas (p = 0.126). According to the 20% cutoff, the total number of CDKN2A/B HD meningiomas was 6/92 (6.5%), of which 5/46 (10.8%) were CNS WHO grade 3 meningiomas and 1/23 (4.3%) was a CNS WHO grade 2 meningioma (p = 0.304). According to the 30% cutoff, only 4/92 (4.3%) cases were HD for CDKN2A/B and all were CNS WHO grade 3 meningiomas (4/46; 8.7%) (p = 0.175).
3.3 Disease‐Specific Survival Analysis According to CDKN2A/B Status
The median DSS among deaths was 18.4 months (range 0.9–146.2), with 53/92 (57.6%) patients alive at the end of follow‐up (August 2025) and 39/92 (42.4%) patients who died of disease (DOD). No deaths from other causes (DOCs) were considered in the present analysis, as only disease‐related deaths (DODs) were counted as events. According to CDKN2A/B status, all patients with HD ≥ 20% and HD ≥ 30% died of disease within a median survival time ranging from 17.4 to 26.3 months, while all surviving patients were classified as non‐HD for these cutoffs (p = 0.003; p = 0.029). Five out of 17 (29.4%) patients with CDKN2A/B HD ≥ 10% were still alive at the end of the analysis (p = 0.009). Median DSS of CDKN2A/B HD DOD patients versus non‐HD was 15.4 months (range 1.9–74.8) versus 18.4 months (range 0.9–146.2) for the ≥ 1 0% cutoff (p = 0.31), 17.4 months (range 1.9–74.8) versus 18.4 months (range 0.9–146.2) for the ≥ 20% cutoff (p = 0.61) and 26.3 months (range 1.9–74.8) versus 18.4 (range 0.9–146.2) for the ≥ 30% cutoff (p = 0.68). Nevertheless, a significant association with shorter disease‐specific survival in the log‐rank test emerged for all tested cutoffs (HD ≥ 10% p = 0.001; HD ≥ 20% p = 0.0001; HD ≥ 30% p = 0.043) (Figure 1 and Figure S1).
Figure 1.
At a median follow‐up of 69.3 months, DSS differed across CDKN2A/B status and age strata. According to the Aalen–Johansen estimator, the estimated cumulative incidence of disease‐specific death (DSD) at 144 months was 100.0% (95% CI, 100.0–100.0) among patients harbouring a CDKN2A/B HD ≥ 30% aged 55–69 years (n = 3; 3 events) and 100.0% (95% CI, 100.0–100.0) among those aged ≥ 70 years (n = 1; 1 event). No HD cases were present in the < 55‐year group, precluding estimation for that stratum. In contrast, non‐HD meningiomas exhibited substantially lower cumulative incidence rates across younger age groups.
The estimated probability of DSD at 144 months was 14.0% (95% CI, 5.2–37.6) among patients aged < 55 years (n = 20; 4 events), 43.8% (95% CI, 26.1–66.5) among those aged 55–69 years (n = 30; 13 events) and 72.0% (95% CI, 54.6–87.4) among patients aged ≥ 70 years (n = 38; 18 events).
When comparing HD and non‐HD tumours within age strata, a significant difference in DSD rates was observed among older patients (≥ 70 years; χ2(1) = 7.68, p = 0.006), whereas no significant difference emerged in the 55–69‐year group (χ2(1) = 0.23, p = 0.63). The comparison could not be performed for patients younger than 55 years due to the absence of HD cases. In the age‐stratified log‐rank test pooling all age groups, the overall difference between HD and non‐HD meningiomas did not reach statistical significance (χ2(1) = 1.49, p = 0.22), although the results suggested a trend toward worse DSS among older patients with CDKN2A/B homozygous deletions (Figure 2).
Figure 2.
Additionally, we investigated the effect of age, grade and CDKN2A/B HD upon DSS using Cox regression analysis. Age (HR = 2.6; 95% CI, 1.13–6.03; p = 0.025), higher histological grade (HR = 17.1; 95% CI, 5.24–55.8; p < 0.001), CDKN2A/B HD ≥ 10% (HR = 3.05; 95% CI, 1.52–6.14; p = 0.002), HD ≥ 20% (HR = 4.73; 95% CI, 1.96–11.45; p = 0.001) and HD ≥ 30% (HR = 4.06; 95% CI, 1.43–11.52; p = 0.009) showed a negative impact on survival in univariate analysis (Table 1).
Univariate Cox proportional hazards analysis according to DSS.
| HR | CI | p | ||
|---|---|---|---|---|
| Age | Linear | 2.7 | 1.16–6.23 | 0.021 |
| Sex | M vs. F | 1.14 | 0.61–2.14 | 0.687 |
| CDKN2A/B HD | ≥ 10% | 2.8 | 1.41–5.62 | 0.003 |
| ≥ 20% | 3.73 | 1.54–9.05 | 0.004 | |
| ≥ 30% | 3.01 | 1.05–8.67 | 0.041 | |
| Grade | 1/2 vs. 3 | 16.3 | 4.99–53.1 | < 0.001 |
| MTAP | < 10% | 1.51 | 0.63–3.64 | 0.355 |
| p16 | < 10% | 0.81 | 0.42–1.58 | 0.541 |
| MTAP/p16 | < 10% | 0.84 | 0.44–1.59 | 0.591 |
Note: Significance: p < 0.05.
3.4 Immunohistochemistry Evaluation and Correlation With FISH Analysis
MTAP and p16 IHC were evaluated by two independent pathologists in the same slide selected for FISH analysis according to the criteria reported in the Methods section. In case of disagreement, a consensus was reached by joint review and discussion. While p16 and MTAP immunohistochemistry were performed on whole tissue sections, their assessment was limited to the same tumour area selected for FISH analysis. Only the p16/MTAP staining pattern within this corresponding region was used for correlation with FISH, ensuring that the molecular and immunohistochemical evaluations were spatially aligned and referred to the same portion of the tumour. Both markers' sensitivity and specificity were assessed in relation to CDKN2A/B status, either alone or in combination (Table 2). Overall, 11/92 (11.9%) and 35/92 (38%) cases showed negative MTAP and p16 staining, respectively. Of the 17 cases harbouring CDKN2A/B HD ≥ 10%, 5 (29.4%) were also MTAP negative (p = 0.014; sensitivity 29.41%, specificity 92%) and 7 (41.2%) p16 negative (p = 0.768; sensitivity 41.2%, specificity 62.7%). For CDKN2A/B HD ≥ 20%, 3/6 (50%) cases showed negative MTAP (p = 0.021; sensitivity 50%, specificity 90.7%), and p16 (p = 0.670; sensitivity 50%, specificity 62.8%) staining, whereas among the 4 CDKN2A/B HD ≥ 30% cases, 2/4 (50%) were MTAP negative (p = 0.069; sensitivity 50%, specificity 89.8%) and 3/4 (75%) p16 negative (p = 0.152; sensitivity 75%, specificity 63.6%). Figure 3 illustrates examples of the evaluated CDKN2A/B HD cutoffs with the corresponding MTAP and p16 staining patterns. Subsequently, the combined performance of the two markers was evaluated in relation to CDKN2A/B status to determine whether their joint use could improve their accuracy. Results differed slightly from those obtained with individual marker use: the HD cases also negative for IHC were 10/17 (58.8%) for the ≥ 10% cutoff (p = 0.227; sensitivity 58.8%, specificity 57.3%), 5/6 (83.3%) for the ≥ 20% cutoff (p = 0.089; sensitivity 83.3%, specificity 57%) and 4/4 for the ≥ 30% cutoff (p = 0.040; sensitivity 100%, specificity 56.8%). However, concordance between MTAP and p16 staining was observed in only 54/92 (58.7%) cases (Cohen's kappa coefficient = −0.010), indicating no significant agreement beyond chance.
MTAP, p16 and MTAP/p16 performance according to different CDKN2A/B HD cutoffs.
| CDKN2A/B HD cutoff | Sensitivity | Specificity | p | |
|---|---|---|---|---|
| MTAP | ≥ 10% | 29.41% | 92% | 0.014 |
| ≥ 20% | 50% | 90.7% | 0.003 | |
| ≥ 30% | 50% | 89.8% | 0.016 | |
| p16 | ≥ 10% | 41.18% | 62.7% | 0.768 |
| ≥ 20% | 50% | 62.8% | 0.533 | |
| ≥ 30% | 75% | 63.6% | 0.120 | |
| MTAP/p16 | ≥ 10% | 58.8% | 57.3% | 0.227 |
| ≥ 20% | 83.3% | 57% | 0.055 | |
| ≥ 30% | 100% | 56.8% | 0.026 |
Note: Significance: p < 0.05.
Figure 3.
3.5 Disease‐Specific Survival Analysis According to MTAP and p16 Status
Of the 39 patients who had died of disease at the end of the analysis, 6 (15.4%) were MTAP negative (p = 0.385) and 15 (38.5%) p16 negative (p = 0.944). When combined, 18/39 cases had negative IHC (46.2%) (p = 0.934). Median DSS in positive versus negative IHC cases was 21.6 months (range 0.9–146.2) versus 8.7 months (range 2.6–64) for MTAP (p = 0.97); 16.1 months (range 1.4–64) versus 21.6 months (range 0.9–146.2) for p16 (p = 0.17); 16.9 months (range 1.4–59.7) versus 20.5 (range 0.9–146.2) considering MTAP and/or p16 (p = 0.97). No immunohistochemical surrogate marker, assessed either individually or in combination, was found to be significantly associated with disease‐specific survival in the log‐rank test (MTAP p = 0.437; p16 p = 0.179; MTAP/p16 p = 0.70) (Figure 4), nor in univariate Cox proportional hazards analysis (Table 1).
Figure 4.
3.6 FISH and IHC Spatial Heterogeneity Assessment
In a subset of five cases showing marked heterogeneity in IHC staining, FISH analysis was repeated on two distinct regions of the same tissue block (Figure S2). These were selected based on either MTAP or p16 IHC when the difference in staining intensity between areas was > 20%. Three cases were selected according to p16 staining, one according to MTAP staining and the final case showed heterogeneity for both markers. In two cases (TO3 and TO15), CDKN2A/B HD status differed markedly between the two areas, showing good concordance with p16 but not with MTAP IHC.
4 Discussion
In this study, the prognostic impact of different thresholds for CDKN2A/B HD was assessed in a large cohort of meningiomas. CDKN2A/B loss emerged as a strong adverse prognostic factor for DSS, particularly when a deletion threshold of ≥ 20% was applied, confirming its role as a robust and independent marker of aggressive behaviour. In contrast, IHC surrogate markers MTAP and p16 showed variable concordance with CDKN2A/B status and failed to reliably predict survival, underscoring the limitations of IHC‐based approaches in this context.
Accurate identification of meningiomas harbouring unfavourable molecular profiles is increasingly relevant in light of the updated WHO classification. The negative prognostic impact of CDKN2A/B HD has been consistently demonstrated in multiple large cohorts, although most studies relied on genome‐wide approaches such as methylation profiling or next‐generation sequencing (NGS). In contrast, data derived from FISH, including validated cutoff values, remain limited and heterogeneous [13, 14, 19]. To address this gap, we performed a stepwise evaluation of three incremental FISH thresholds (≥ 10%, ≥ 20% and ≥ 30%) to define biologically and clinically meaningful CDKN2A/B HD.
All tested thresholds were significantly associated with adverse outcome, with prognostic relevance maintained even at the highest cutoff despite the limited number of cases. Notably, all patients harbouring CDKN2A/B HD ≥ 20% died within approximately 2 years of diagnosis, further supporting the clinical impact of this alteration [5, 6]. These findings are consistent with those of Li et al., who identified 23% as the optimal cutoff to maximise concordance between FISH and NGS results [20]. Moreover, cumulative incidence analysis revealed a significantly higher disease‐specific mortality in patients aged ≥ 70 years with HD ≥ 30% compared to non‐HD cases, suggesting a possible age‐dependent effect of CDKN2A/B loss on tumour aggressiveness. Based on these observations and to minimise technical noise related to truncated nuclei or signal loss, we propose adopting a more stringent threshold (e.g., ≥ 30%), as already recommended for other CNS tumours [17].
Given the technical and interpretative challenges associated with FISH, reliable IHC surrogates for CDKN2A/B HD would represent a major practical advantage in routine diagnostics. Both p16 and MTAP IHC have been extensively investigated as surrogate markers, but published results remain inconsistent [11, 12, 13, 15, 16, 19, 21, 22]. While p16 loss has been proposed as a common finding in CNS WHO grade 1 and 2 meningiomas [15], some studies reported high sensitivity and specificity in malignant tumours, although the number of high‐grade cases harbouring CDKN2A/B HD was often small [11]. Instead, MTAP has been suggested to outperform p16 in terms of specificity and may potentially serve as a standalone surrogate [13, 14], although other studies cautioned against relying on MTAP alone [19].
In our cohort, both markers showed variable diagnostic performance depending on the applied deletion threshold. MTAP IHC demonstrated high specificity (89.8%–92%) but modest sensitivity (29.4%–50%), whereas p16 showed highly variable sensitivity (41.2%–75%) and moderate specificity (62.7%–63.6%). These findings align with prior evidence that p16 expression can be lost through mechanisms unrelated to gene deletion [12, 13], particularly in lower‐grade tumours where baseline expression is often minimal [19]. Conversely, MTAP loss appears more specific for true deletions but may miss partial or heterogeneous alterations that spare the MTAP locus [13, 16]. Combining MTAP and p16 did not improve overall accuracy, yielding only marginal gains in sensitivity at the highest deletion cutoff (58.8%–100%) at the expense of a substantial loss of specificity (56.0%–57.3%).
Intratumoral heterogeneity further complicates the use of IHC surrogates. Previous reports described subclonal CDKN2A/B and MTAP deletions associated with regionally distinct staining patterns [19], consistent with known spatial genetic heterogeneity in meningiomas [23, 24, 25]. Our own validation of discrepant regions confirmed variable correlations between IHC and FISH, with p16 showing partial concordance in a few cases. Despite a higher proportion of deceased patients showing MTAP loss, neither MTAP nor p16 IHC was significantly associated with disease‐specific survival. This suggests that IHC markers do not adequately capture the biological aggressiveness conferred by CDKN2A/B HD, limiting their prognostic utility. These discrepancies align with prior observations that concordance between IHC, FISH and molecular methods is highly dependent on threshold selection and tumour heterogeneity [20]. Even though combined MTAP and p16 staining did not enhance diagnostic performance overall, their joint use may retain practical value in guiding tissue selection for molecular testing in heterogeneous tumours [12, 13].
Although the number of CDKN2A/B HD‐positive cases appears limited in our series, its prevalence at the ≥ 30% threshold is consistent with published rates (< 5%) [3, 7]. Importantly, our cohort represents one of the largest series to date enriched for CNS WHO grade 3 meningiomas, providing a more robust basis for analysis compared with prior studies analysing 3–15 CNS WHO grade 3 meningiomas [11, 12, 13, 14, 16]. A further limitation could be the use of FISH as a reference assay, as it represents a single‐cell–level quantitative technique; however, recent comparative studies demonstrated high concordance between FISH and bulk methods such as NGS for CDKN2A/B HD detection, supporting its reliability despite inherent technical constraints [20, 22].
In conclusion, CDKN2A/B HD is confirmed as a clinically meaningful adverse prognostic factor in meningiomas, particularly at thresholds ≥ 20%. In contrast, MTAP and p16 IHC show inconsistent correlation with molecular status and no independent prognostic value. While MTAP may retain limited utility due to higher specificity, neither marker can replace direct molecular testing, though both may serve as ancillary tools for tissue selection in the context of intratumoral heterogeneity.
Author Contributions
P.C. and L.B. designed the study. A.A.R. and F.N. conducted data analysis and wrote the manuscript. A.A.R. performed H&E and IHC staining. F.N. and A.B. were responsible for histological revision and immunohistochemistry evaluation. C.T. and L.V.C. carried out FISH analysis. D.G., M.L., R.R., C.B., A.D.P., L.L. and I.D. provided clinical data for the study. All authors reviewed and approved the final manuscript.
Funding
This study was supported by research grants from Fondazione Ricerca Molinette ETS, Turin, Italy, Fondazione CRT (Grant reference number: 113265/2025.0323), Turin, Italy, and Rete Oncologica Piemonte e Valle d'Aosta, Turin, Italy to L.B.
Ethics Statement
The study was conducted in accordance with the ethical standards of the University of Turin IRB and with the Code of Ethics of the World Medical Association (Declaration of Helsinki and following amendments). The Florence cohort was included in this study according to the Local Ethics Committee of Tuscany (Protocol Number: 27080_BIO).
Consent
Informed consent to the surgical procedure and data collection was obtained from all subjects involved in the study, while dedicated written informed consent was unnecessary because of the retrospective nature of the study.
Conflicts of Interest
The authors declare no conflicts of interest.
Supporting information
Figure S1: DSS KM cumulative analysis according to all CDKN2A/B HD tested cutoff values.

Figure S2: FISH and IHC spatial heterogeneity assessment and quantification in multiple areas of samples TO3, TO15, TO59, TO60 and TO74.

Table S1: Features of CNS WHO grade 3 meningiomas according to CNS WHO 2021. Seventeen CNS WHO grade 3 meningiomas (34%) were classified based solely on mitotic count, while three cases (6%) exhibited overt anaplasia as the only criterion. Three additional cases were reclassified based on molecular features: one due to CDKN2A/B HD ≥ 30%, one due to the presence of a TERT promoter pathogenic mutation and one that harboured both alterations.
Acknowledgements
Open access publishing facilitated by Universita degli Studi di Torino, as part of the Wiley ‐ CRUI‐CARE agreement.
Data Availability Statement
The collected/analysed data are not publicly available to protect patients' privacy and comply with ethical requirements. Aggregated data supporting the study findings are available from the corresponding author upon a reasonable request.
References
- 1 M. Price , C. Ballard , J. Benedetti , et al., “Cbtrus Statistical Report: Primary Brain and Other Central Nervous System Tumors Diagnosed in the United States in 2017‐2021,” Neuro‐Oncology 26 (2024): vi1‐vi85, 10.1093/neuonc/noae145.39371035 PMC11456825
- 2 Board, W. C. o. T. E , Who Classification of Tumours, 5th Ed. Central Nervous System Tumours, vol. 6 (International Agency for Research on Cancer, 2021), https://publications.iarc.fr/601.
- 3 F. Sahm , K. D. Aldape , P. K. Brastianos , et al., “Cimpact‐Now Update 8: Clarifications on Molecular Risk Parameters and Recommendations for WHO Grading of Meningiomas,” Neuro‐Oncology 27 (2025): 319–330, 10.1093/neuonc/noae170.39212325 PMC11812049
- 4 A. Perry , R. Banerjee , C. M. Lohse , B. K. Kleinschmidt‐DeMasters , and B. W. Scheithauer , “A Role for Chromosome 9p21 Deletions in the Malignant Progression of Meningiomas and the Prognosis of Anaplastic Meningiomas,” Brain Pathology 12 (2002): 183–190, 10.1111/j.1750-3639.2002.tb00433.x.11958372 PMC8095834
- 5 P. Sievers , T. Hielscher , D. Schrimpf , et al., “CDKN2A/B Homozygous Deletion Is Associated With Early Recurrence in Meningiomas,” Acta Neuropathologica 140 (2020): 409–413, 10.1007/s00401-020-02188-w.32642869 PMC7423850
- 6 J. Bostrom , B. Meyer‐Puttlitz , M. Wolter , et al., “Alterations of the Tumor Suppressor Genes CDKN2A (p16(INK4a)), p14(ARF), CDKN2B (p15(INK4b)), and CDKN2C (p18(INK4x)) in Atypical and Anaplastic Meningiomas,” American Journal of Pathology 159 (2001): 661–669, 10.1016/S0002-9440(10)61737-3.11485924 PMC1850553
- 7 J. Z. Wang , V. Patil , J. Liu , et al., “Increased MRNA Expression of CDKN2A Is a Transcriptomic Marker of Clinically Aggressive Meningiomas,” Acta Neuropathologica 146 (2023): 145–162, 10.1007/s00401-023-02571-3.37093270 PMC10261216
- 8 C. J. Sherr , “The INK4a/ARF Network in Tumour Suppression,” Nature Reviews. Molecular Cell Biology 2 (2001): 731–737, 10.1038/35096061.11584300
- 9 K. J. Groff , R. V. Patel , Y. Feng , et al., “The Effect of Tert Promoter Mutation on Predicting Meningioma Outcomes: A Multi‐Institutional Cohort Analysis,” Lancet Oncology 26 (2025): 1178–1190, 10.1016/S1470-2045(25)00422-X.40907515 PMC13090858
- 10 S. Serra and R. Chetty , “P16,” Journal of Clinical Pathology 71 (2018): 853–858, 10.1136/jclinpath-2018-205216.30076191
- 11 V. Tang , R. Lu , K. Mirchia , et al., “Loss of p16 Expression Is a Sensitive Marker of CDKN2A Homozygous Deletion in Malignant Meningiomas,” Acta Neuropathologica 145 (2023): 497–500, 10.1007/s00401-023-02544-6.36723772 PMC10020299
- 12 K. Tosefsky , K. C. Martin , A. D. Rebchuk , et al., “Molecular Prognostication in Grade 3 Meningiomas and p16/MTAP Immunohistochemistry for Predicting CDKN2A/B Status,” Neuro‐Oncology Advances 6 (2024): vdae002, 10.1093/noajnl/vdae002.38288091 PMC10824160
- 13 H. I. Ozkizilkaya , A. Vinocha , A. Dono , et al., “MTAP and p16 IHC as Markers for CDKN2A/b Loss in Meningiomas,” Cancers (Basel) 16 (2024): 3299, 10.3390/cancers16193299.39409918 PMC11476088
- 14 S. Salzano , R. Caltabiano , G. Magro , et al., “MTAP and p16 as Immunohistochemical Surrogates of CDKN2A/b Homozygous Deletion in Central Nervous System Tumors: A Multicentre Italian Experience,” Annals of Diagnostic Pathology 79 (2025): 152524, 10.1016/j.anndiagpath.2025.152524.40638988
- 15 V. Zschernack , F. Andreiuolo , E. Dorner , et al., “P16 Immunohistochemistry as a Screening Tool for Homozygous CDKN2A Deletions in CNS Tumors,” American Journal of Surgical Pathology 48 (2024): 46–53, 10.1097/PAS.0000000000002148.37947008 PMC10723769
- 16 S. Sasaki , M. Takeda , T. Hirose , et al., “Correlation of MTAP Immunohistochemistry With CDKN2A Status Assessed by Fluorescence In Situ Hybridization and Clinicopathological Features in CNS WHO Grade 2 and 3 Meningiomas: A Single Center Cohort Study,” Journal of Neuropathology and Experimental Neurology 81 (2022): 117–126, 10.1093/jnen/nlab127.34897475
- 17 D. F. Marker and T. M. Pearce , “Homozygous Deletion of CDKN2A by Fluorescence In Situ Hybridization Is Prognostic in Grade 4, but Not Grade 2 or 3, IDH‐Mutant Astrocytomas,” Acta Neuropathologica Communications 8 (2020): 169, 10.1186/s40478-020-01044-y.33081848 PMC7574334
- 18 C. Mirian , L. R. Jensen , T. A. Juratli , et al., “The Importance of Considering Competing Risks in Recurrence Analysis of Intracranial Meningioma,” Journal of Neuro‐Oncology 166 (2024): 503–511, 10.1007/s11060-024-04572-y.38336917 PMC10876814
- 19 V. Zschernack , G. Pinto , L. L. Friker , et al., “Pitfalls in the Evaluation of CDKN2A Copy Number Status in Meningioma,” Journal of Neuro‐Oncology 173 (2025): 769–776, 10.1007/s11060-025-05029-6.40227557 PMC12170679
- 20 H. Li , N. Luo , C. Fan , et al., “Assessment of CDKN2A Homozygous and Heterozygous Deletions in Gliomas Across Multiple Detection Platforms,” BMC Cancer 25 (2025): 1007, 10.1186/s12885-025-14266-x.40474207 PMC12143045
- 21 T. Maragkou , S. Reinhard , P. Jungo , et al., “Evaluation of MTAP and p16 Immunohistochemical Deficiency as Surrogate Marker for CDKN2A/b Homozygous Deletion in Gliomas,” Pathology 55 (2023): 466–477, 10.1016/j.pathol.2023.01.005.37032198
- 22 A. Tauziede‐Espariat , A. Rousseau , L. Basset , et al., “A Comparison of CDKN2A Status in Gliomas Using Different Techniques: The Loss of p16 as a Surrogate Marker,” Journal of Neuropathology and Experimental Neurology 84 (2025): 847–854, 10.1093/jnen/nlaf062.40445894
- 23 W. L. Bi , N. F. Greenwald , M. Abedalthagafi , et al., “Genomic Landscape of High‐Grade Meningiomas,” NPJ Genomic Medicine 2 (2017): 15, 10.1038/s41525-017-0014-7.28713588 PMC5506858
- 24 S. T. Magill , H. N. Vasudevan , K. Seo , et al., “Multiplatform Genomic Profiling and Magnetic Resonance Imaging Identify Mechanisms Underlying Intratumor Heterogeneity in Meningioma,” Nature Communications 11 (2020): 4803, 10.1038/s41467-020-18582-7.PMC751197632968068
- 25 H. N. Vasudevan , S. E. Braunstein , J. J. Phillips , et al., “Comprehensive Molecular Profiling Identifies FOXM1 as a Key Transcription Factor for Meningioma Proliferation,” Cell Reports 22 (2018): 3672–3683, 10.1016/j.celrep.2018.03.013.29590631 PMC8204688