- 84 例晚期 AD、最多 23 个脑区的 4G8 DAB 染色切片:随机森林像素分类器分割沉积物,卷积神经网络分为 6 类(核心斑、淡染弥漫斑、浓染弥漫斑、致密斑、小致密斑、CAA);测试集召回率 81.5%、精确率 82.4%。
- 皮质脑区 Aβ 斑块负荷最高,以淡染弥漫斑和小致密斑为主;海马区与皮质区内部及之间斑块密度相关。
- 浓染弥漫斑、小致密斑、致密斑彼此正相关;核心斑与 CAA 不与其他类别相关,且只有核心斑与内嗅皮质 tau 负荷正相关。
- 女性与更多弥漫斑相关,ApoE4 与浓染弥漫斑/小致密斑相关;发病和死亡年龄更早者淡染弥漫斑密度更高。
收录范围:Acta Neuropathologica 开放获取全文(CC BY 4.0)摘要、引言、材料与方法、结果、讨论、结论,8 幅图及 3 个表(含表注);参考文献、补充材料、作者信息与声明未收录,方括号数字为原文参考文献序号。
摘要
淀粉样β蛋白(Aβ)沉积和 tau 蛋白积聚是阿尔茨海默病(AD)的神经病理学标志。尽管 Aβ 沉积物具有多种形态,目前仍缺乏对 AD 中 Aβ 斑块组成及其与临床病理特征关联的全面、跨脑区概述。本研究系统记录了 84 例晚期 AD 病例中每例最多 23 个脑区的 Aβ 斑块丰度和形态多样性。在 4G8 二氨基联苯胺染色切片中,利用随机森林像素分类器对沉积物进行分割,并通过卷积神经网络将其分为六类(核心斑、淡染弥漫斑(diffuse light)、浓染弥漫斑(diffuse dense)、致密斑、小致密斑(small dense)、脑淀粉样血管病(CAA))。采用 Pearson 相关分析,考察不同类别、脑区之间的沉积物计数以及沉积物计数与 tau 负荷的相关性。分析了斑块密度与共病理、性别、ApoE、家族性与散发性病例、临床起病年龄、病程及死亡年龄的关联。分类模型在测试集中的召回率为 81.5%,精确率为 82.4%。皮质脑区的 Aβ 斑块负荷最高,主要由淡染弥漫斑和小致密斑组成。海马各区内部、皮质各区内部以及海马与皮质脑区之间的斑块密度均存在相关性。浓染弥漫斑、小致密斑和致密斑的丰度彼此呈正相关,而核心斑和 CAA 的密度与其他斑块类别不相关。仅核心斑与内嗅皮质 tau 负荷呈正相关,其他斑块类别除 CAA 外均呈负相关。值得注意的是,女性与更多的弥漫斑相关,ApoE4 与浓染弥漫斑和小致密斑相关。较早的起病年龄和死亡年龄与较高的淡染弥漫斑密度相关。总体而言,这些关联因脑区和斑块类别而异。核心斑和 CAA 在统计学上与其他 Aβ 沉积物表现不同,提示它们在疾病进程中具有不同的关联模式。
引言
淀粉样β蛋白(Aβ)斑块与过度磷酸化 tau 蛋白沉积共同构成阿尔茨海默病(AD)的神经病理学标志 [12, 44, 82];AD 是最常见的痴呆类型 [43, 44]。Aβ 是淀粉样前体蛋白(APP)的裂解产物,主要在脑内细胞外间隙积聚,并通过错误折叠和种子诱导的蛋白聚集传播 [38, 53, 82]。按照 Thal 分期 1 至 5 期,聚集通常始于联合皮质,随后在较晚阶段出现于皮质下区域、脑干和小脑 [73]。因此,Aβ 被视为 AD 相关病理改变的启动因素,先于 tau 病理、突触和神经元丢失以及认知下降出现 [5, 32, 82]。携带 APP 或 PSEN1/2 突变的家族性阿尔茨海默病病例存在 Aβ 代谢改变,这一事实有力地支持了上述观点 [82]。尽管总体 Aβ 负荷不能单独解释痴呆过程中发生的全部变化 [21],许多治疗方法仍以 Aβ 沉积为靶点,并取得了不同程度的疗效 [5, 30, 95]。
一个使问题复杂化的因素是 Aβ 沉积具有高度异质性 [40, 72, 82, 85]。沉积物包括常被描述的弥漫斑、经典核心斑、脑淀粉样血管病(CAA)[72, 82],以及棉絮斑 [35, 45] 和粗颗粒斑 [9, 10] 等特殊斑块类型。此外,还观察到一些没有明确名称的沉积物,表现为软脑膜下带状沉积、星芒状沉积、小点状沉积和细胞内包涵体 [82]。除斑块外,Aβ 还以具有毒性的小分子寡聚体形式存在,其中一部分可能来源于较大的沉积物,或在细胞内生成 [31, 78, 83]。
不同形态可反映局部组织结构和分子组成的改变,并与不同的决定因素和反应相关 [27, 40, 72, 82]。例如,AD 危险因素 ApoE4 与总体较高的皮质 Aβ 负荷相关 [58, 63],其中包括较高的 Aβ 寡聚体负荷 [34]。女性也与较高的 Aβ 负荷相关 [1, 57, 58],但并非所有研究均得到这一结果 [6]。弥漫性 Aβ 斑块常见于无认知障碍的衰老个体 [20, 24],而核心斑则与认知下降相关 [47, 50]。尤其是伴神经突改变的核心斑,已知常伴有小胶质细胞浸润的免疫反应 [67]。此外,有研究提出,部分斑块经历从弥漫性沉积到纤维性和致密程度增加,再到经典核心斑,最终成为缺乏弥漫性环带的“燃尽斑”的演变过程 [62, 72, 82];而其他研究则提示,不同因素影响着斑块形态 [33, 48]。
许多论文讨论了少数脑区中特定 Aβ 斑块的个别成分,但目前仍缺乏在大型人类 AD 队列中跨脑区定量和分类 Aβ 斑块的全面概述。开展大规模研究需要自动化分析。近年来,已开发出多种 Aβ 斑块分割 [58, 81] 和分类算法,并获得较高的准确率 [3, 40, 60, 71, 80, 89]。然而,现有的光镜斑块分类器往往仅涵盖部分类别,不能代表更广泛的真实组成 [71, 89]。
本研究从包含 84 例晚期家族性和散发性 AD 病例的大型队列中,提取每例最多 23 个脑区的 Aβ 免疫组织化学染色所显示的 Aβ 沉积物。在 Tang 等人 [71] 的卷积神经网络基础上,我们训练了一个涵盖类别更全面的算法:将斑块分为六类,即核心斑、淡染弥漫斑、浓染弥漫斑、致密斑、小致密斑和 CAA。绘制了全脑各区斑块绝对密度和各类别相对负荷的分布,检验其相关性,并分析其与 tau、α-突触核蛋白(α-syn)和 TDP43 共病理的关联。此外,还研究了其与性别、ApoE 基因型、家族性 AD 突变、临床起病年龄、病程及死亡年龄的关联。最后,建立跨因素统计模型,整合多个维度,以识别 Aβ 沉积物各类别特异性的决定因素。
材料与方法
人类队列与神经病理学评估
人脑样本取自慕尼黑神经生物样本库,该样本库按照欧洲脑库网络的行为准则 [39] 并经当地伦理委员会同意收集脑组织。脑组织来自自愿捐献者,捐献前已获得捐献者生前的知情同意,或由最近亲属根据捐献者的推定意愿给予知情同意。本研究遵循《赫尔辛基宣言》原则,并符合当地伦理委员会的要求。神经病理学评估由至少两名具有专科资质认证的神经病理医师完成。
本研究的纳入标准为:1)病例在数字化脑库表单中登记为经神经病理学定义的晚期 AD(Braak 和 Braak 分期 IV、V 或 VI 期);2)具有可用的二氨基联苯胺(DAB)Aβ 染色扫描图像。临床疑诊为其他疾病、但神经病理学检查存在 AD 相关改变的病例,以及伴共病理的病例也予纳入。根据这些标准,最终获得包含 84 例 AD 病例的队列(表 1,图 S1)。
| 可用 n(占队列的百分比) | 队列(绝对值) | 队列(%) | |
|---|---|---|---|
| n (%) | 84 (100%) | 84 | 100% |
| 临床诊断(AD: FTD: PD)a | 84 (100%) | 51: 7: 6 | 61%: 8%: 7% |
| 性别(女: 男) | 84 (100%) | 46: 38 | 55%: 45% |
| 起病年龄[岁] | 70 (83%) | 61.6 ± 12.2 | |
| 病程[年] | 70 (83%) | 10.9 ± 5.9 | |
| 死亡年龄[岁] | 83 (99%) | 73.9 ± 11.4 | |
| Braak 和 Braak 分期(IV: V: VI) | 84 (100%) | 10: 15: 59 | 12%: 18%: 70% |
| Thal 分期(3: 4: 5) | 79 (94%)b | 2: 10: 67 | 3%: 13%: 85% |
| CERAD (B: C) | 73 (87%) | 6: 67 | 8%: 92% |
| ApoE ((E2/E3): (E2/E4): (E3/E3): (E3/E4): (E4/E4)) | 78 (93%) | 4: 1: 28: 38: 7 | 5%: 1%: 36%: 49%: 9% |
| WGS(无突变: APP: PSEN1: PSEN2: TREM2) | 70 (83%) | 50: 3: 13c: 3: 1 | 71%: 4%: 19%: 4%: 1% |
| α-syn(阴性: 杏仁核: 脑干: 皮质) | 71 (85%) | 29: 15: 5: 22 | 41%: 21%: 7%: 31% |
| TDP43(阴性: 阳性)d | 60 (71%) | 32: 28 | 53%: 47% |
AD 阿尔茨海默病;PD 帕金森病;FTD 额颞叶痴呆;WGS 全基因组测序 a为清晰起见,此处仅列出最常见的临床诊断。队列的完整诊断列表见图 S1a b在缺失数据的五例中,四例的 Thal 分期 ≥3,另一例 ≥2 c一名患者同时检出 PSEN1 和 TREM2 突变,此处仅列出 PSEN1 突变 dTDP43 状态的二分类值提取自生物样本库数据库,依据可用的杏仁核、海马和延髓评估结果确定
将福尔马林固定、石蜡包埋的组织手工切成 5 µm 厚的切片。后续处理在 Ventana Bench-Mark Ultra 系统(Roche)中进行。切片先用 80% 甲酸预处理 15 min,并使用基于 Tris 的 Cell Conditioning(CC1)缓冲液(Roche)。Aβ 染色以单克隆抗体 4G8(BioLegend,#800,701;稀释比例 1:5000)为一抗,使用 Ventana 抗体稀释缓冲液(Roche,#251–018)稀释。采用 ultraView Universal DAB 检测试剂盒(#760–500,Roche)显色,并使用苏木精和返蓝试剂(Roche)进行细胞核复染。采用单克隆抗体 AT8(ThermoFisher,#MN1020;稀释比例 1:400)进行磷酸化 tau 染色,以及采用单克隆抗体(克隆 42;BDTransduction,#610,787;稀释比例 1:1000)进行 α-syn 染色的细节已在既往文献中描述 [58]。
根据慕尼黑神经生物样本库中各 AD 病例 Aβ 染色的可用情况,每例最多纳入 23 个脑区进行进一步分析(图 1,图 S2)。这些脑区包括十一个皮质区、五个皮质下区、作为海马亚区的 CA1-4 和下托,以及小脑皮质和小脑齿状核。
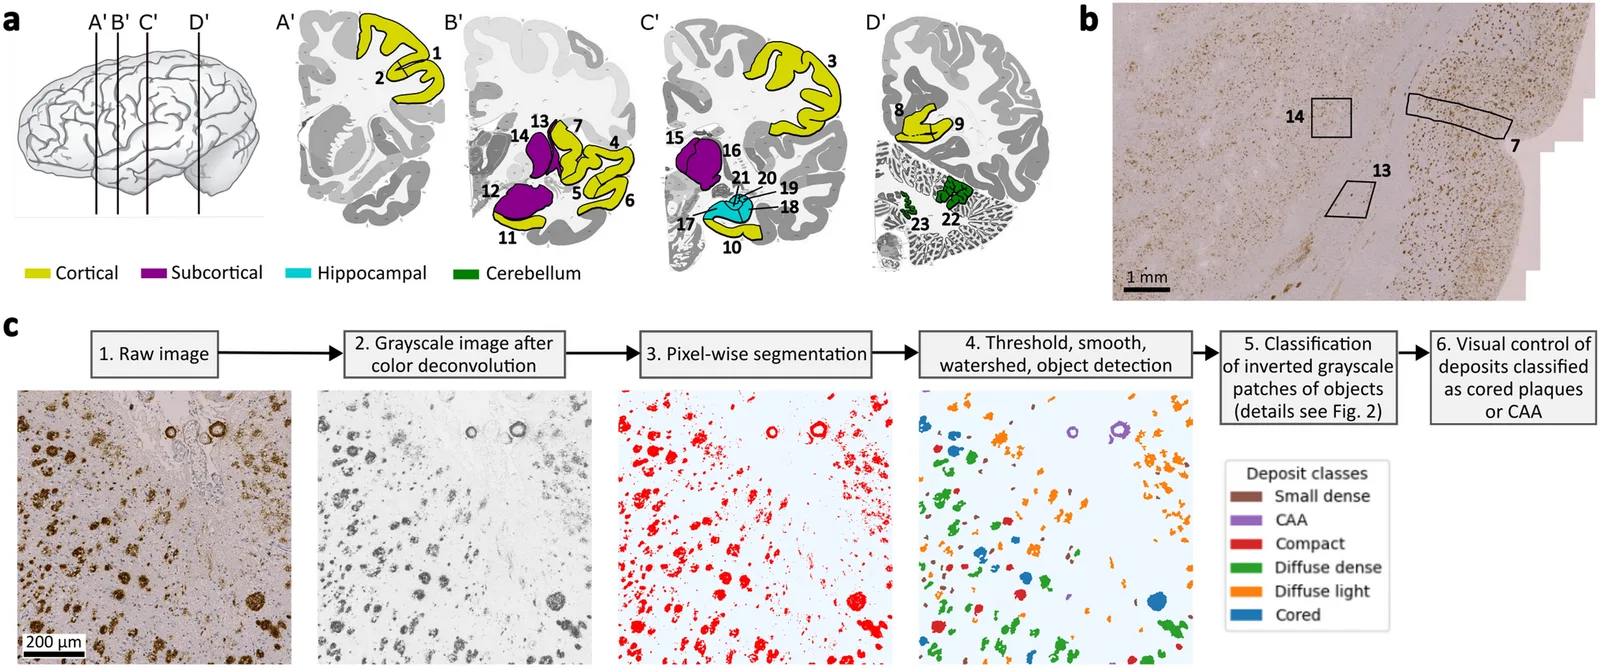
ApoE 基因型和 AD 相关突变提取自全基因组测序数据,相关方法已在既往文献中描述 [58, 69]。简言之,使用 QIAmp DNA Mini 试剂盒(Qiagen,51,304)从新鲜冷冻小脑组织中分离 DNA。使用 TruSeq 无 PCR 基因组 DNA 文库制备试剂盒(Illumina,FC-121-3003)构建文库。在 Illumina NovaSeq 测序仪上对 2×150 bp 双端文库进行测序,深度至少为 35X。采用整合 GATK 最佳实践的 Snakemake 流程进行序列比对和变异检测。使用 FastQC 进行质量控制。去除接头后,使用 BWA-MEM2 将序列比对至 hs1/T2T 基因组组装(chm13v2.0)。使用 GATK(4.0 版)进行变异检测、重新校准和联合基因分型。提取 ApoE 特异性变异(rsID/hs1 坐标:rs429358/chr19:47,733,380;rs7412/chr19:47,733,518),以确定 ApoE 基因型。
图像分析与沉积物检测
图像采集和初步沉积物检测按照既往描述的方法进行 [58]。简言之,使用 Zeiss Axio Scan Z.1 扫描仪,以 20× 放大倍数将 Aβ 染色切片数字化。按照标准化方案(表 S1)[58],如有同一样本的 α-突触核蛋白染色切片,则在 QuPath(0.5.1 版)[4] 中手工标注其灰质区域,并在 Python(Python 3.10.12 版)中使用 DeeperHistreg 进行非刚性配准,将标注映射至 Aβ 和 tau 染色切片 [58, 86,87,88]。皮质区域采用从白质延伸至皮质表面的矩形进行标注,以一致地覆盖所有皮质层。必要时修正标注,以避开伪影或大血管。皮质区域的目标标准化面积约为 1 mm2,非皮质区域约为 0.7 mm2。实际操作中,由于感兴趣区较小、尸检取材时切面的位置等解剖条件,标注面积存在一定程度的变化(详见表 S1)。
为进行后续计算,将标注区域划分为 4096*4096 像素(900*900 µm2)的图块。预处理过程中,对 Aβ 和 tau 图块进行颜色解卷积,以提取棕色 DAB 信号,并转换为灰度图像。将使用 ilastik(1.4.0 版)训练的 Aβ 沉积物检测随机森林像素分类器,以及另一个用于 tau 检测的像素分类器 [58] 应用于这些灰度图像,生成概率图。对 Aβ 和 tau 概率图均使用 0.7 的阈值提取沉积物分割结果。随后,将分割区域面积除以所标注感兴趣区的总面积,计算 Aβ 和 tau 覆盖面积比例。
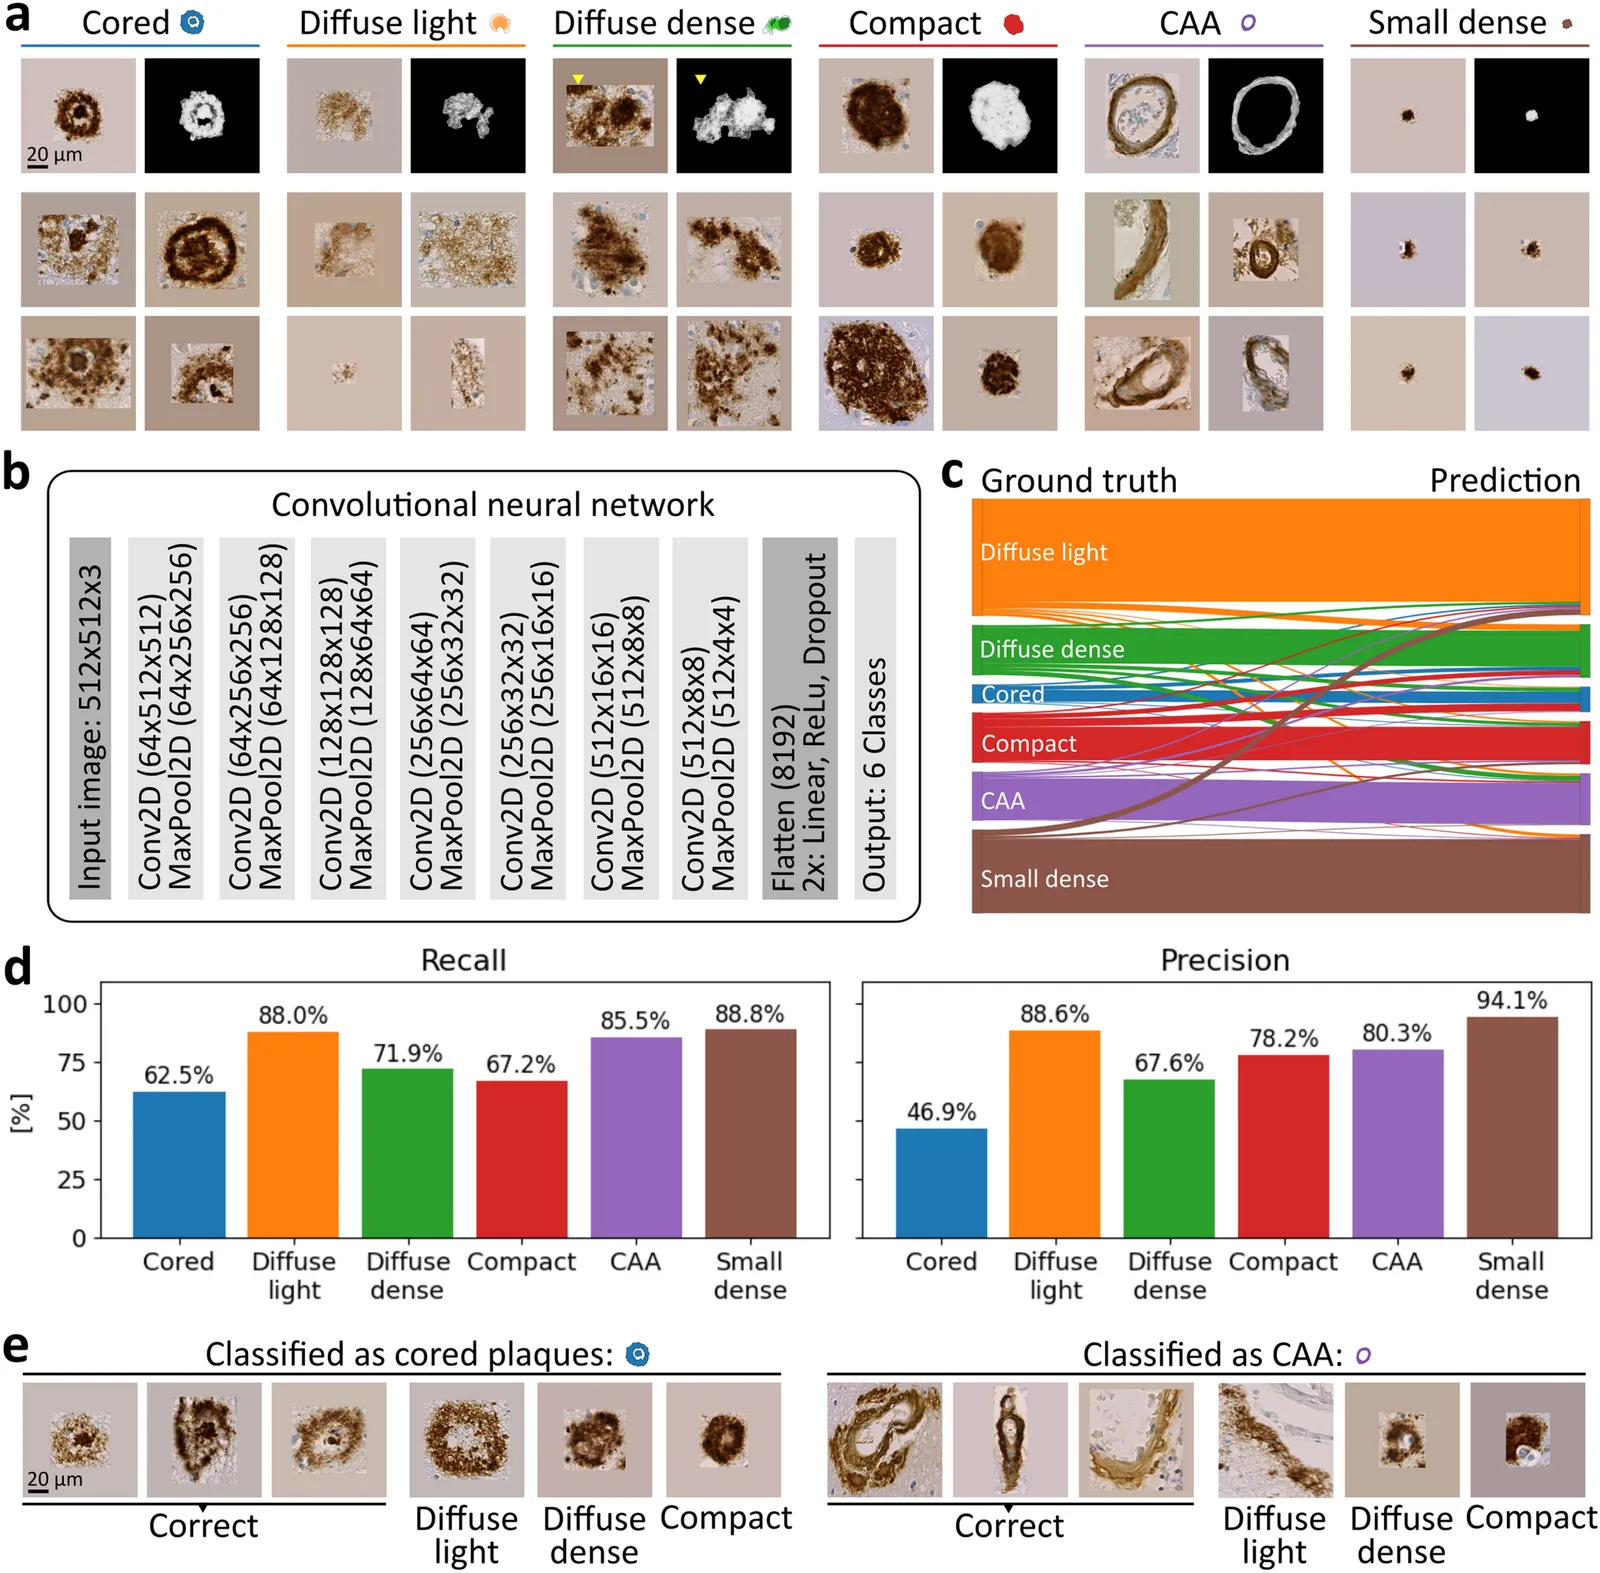
为提取单个 Aβ 沉积物,对沉积物分割掩膜进行平滑处理,以便将核心斑和弥漫斑分别作为完整对象捕获。例如,核心斑的致密核心及其周围较弥漫的 Aβ 阳性区域应被检测为一个连续的斑块,而非两个分离的成分。由于此步骤会使边界不够清晰的弥漫斑融合,因此对异常大的沉积物(> 80,000 像素,相当于 3865 µm2)增加分水岭处理步骤。通过大小阈值去除小沉积物(< 2070 像素,相当于 100 µm2),因为多数小沉积物无法进行有意义的区分,同时也可减少计算工作量。沉积物面积超过 50% 位于所标注感兴趣区之外者,被作为外部沉积物排除。将按上述方式定义的对象掩膜(图 1c)应用于底层灰度或彩色图像,以对象掩膜为中心提取 512*512 像素的正方形图像(图 2a)。从灰度图像中提取沉积物用于机器学习分类,从原始彩色图像中提取沉积物用于人工标注。较大的沉积物缩小至标准化正方形尺寸。对于意外出现在正方形图像内、但不属于目标沉积物的相邻沉积物,从灰度图像中予以去除。
Aβ 沉积物分类
既往模型,包括 Tang 等人 [71] 的模型,主要关注三类,即核心斑、弥漫斑和 CAA;我们的目标是区分更多类别:a)捕获并描述更广泛的斑块类型及其异质性;b)能够对所有检测到的沉积物进行有意义的分类。类别定义依据文献描述及形态上可重复的可区分性。初步人工分类尝试最终形成了核心斑、淡染弥漫斑、浓染弥漫斑、致密斑、CAA 和小致密斑的区分。各类描述列于表 2。用于训练分类器的沉积物提取自研究队列中选定的完整图块,这些图块至少有部分区域包含脑区标注。通过目视选择这些图块,以涵盖广泛的形态。特别注意确保核心斑和 CAA 的多样性,否则它们在数量上的代表性会更加不足。最终,训练集与后续评估的沉积物存在部分重叠,但并非完全属于后者的子集。来自 52 名患者不同脑区训练图像的共 3139 个沉积物由一名评估者(AN)人工分类,并经具有专科资质认证的神经病理医师目视确认。虽然由一名主要评估者进行人工分类会给分类器引入偏倚,但这种偏倚在沉积物评估和后续校正过程中保持一致。尽管预先制定了斑块定义并提供参考图像,许多沉积物仍无法被明确分类;在主观分类的基础上维持一致性,是对这项精细任务的现实近似。将每类沉积物的 15% 随机分配至测试集,其余 85% 分配至训练集。再从后者中随机选取 20%,用于超参数优化过程中的验证(表 3)。
| 类别 | 描述 |
|---|---|
| 核心斑 | 经典斑块,具有致密核心、无沉积或沉积稀少的环带,以及较致密、常呈弥漫性的外缘 |
| 淡染弥漫斑 | 大部分染色强度较低且无致密中心的弥漫斑;边缘常不清楚;也包括许多软脑膜及软脑膜下沉积物 |
| 浓染弥漫斑 | 具有致密、不规则中心及不清楚边缘的弥漫斑 |
| 致密斑 | 染色强度相对均一、边界大多清楚的致密斑;包括棉絮斑和粗颗粒斑 |
| CAA | 脑淀粉样血管病:血管壁或部分血管壁中的 Aβ 沉积物,常呈环形 |
| 小致密斑 | 小型、大多致密且常呈圆形的沉积物,部分为细胞内 Aβ 沉积物 |
CAA 脑淀粉样血管病
| 类别 | n(全部) | n(训练) | n(验证) | n(测试) | 召回率(测试) | 精确率(测试) |
|---|---|---|---|---|---|---|
| 核心斑 | 161 | 108 | 29 | 24 | 62.5% | 46.9% |
| 淡染弥漫斑 | 999 | 688 | 161 | 150 | 88.0% | 88.6% |
| 浓染弥漫斑 | 424 | 291 | 69 | 64 | 71.9% | 67.6% |
| 致密斑 | 430 | 290 | 76 | 64 | 67.2% | 78.2% |
| CAA | 412 | 280 | 70 | 62 | 85.5% | 80.3% |
| 小致密斑 | 713 | 478 | 128 | 107 | 88.8% | 94.1% |
| 总计 | 3139 | 2135 | 533 | 471 | 81.5% | 82.4% |
召回率(真阳性 /(真阳性 + 假阴性));精确率(真阳性 /(真阳性 + 假阳性));CAA 脑淀粉样血管病。训练时通过额外的数据增强平衡各类别,而测试集仍保持不平衡,以反映更真实的分布。实际应用模型时,通过目视判定纠正“核心斑”和“CAA”类别中明显的假阳性预测,但无法系统性找回被分配至其他类别的假阴性对象
根据各类别代表性不足的程度,通过数据增强扩充各类训练图像,包括旋转、翻转、颜色抖动、平移、剪切和缩放,从而实现类别平衡的训练。
针对图像形态学分类任务,在 Tang 等人 [71] 高性能 Aβ 斑块分类模型架构的基础上,构建了卷积神经网络(CNN)。由于类别数量增加,在 Tang 等人 [71] 实现的架构中增加了一个卷积层,以表征更高的复杂性。此外,调整参数以适应 512*512 像素的输入尺寸。最终结构包含七个 2D 卷积层模块,采用 3×3 卷积核,并配有用于缩小尺寸的最大池化(图 2)。使用交叉熵损失优化模型参数。
进一步针对批量大小、训练轮数、学习率、数据增强幅度以及弥漫斑的区分对 CNN 进行优化(图 S3)。实验显示,批量大小为 18 和 24 时性能相近,参数在第 60 轮前趋于稳定,学习率为 0.0001 且采用中等幅度数据增强时性能最佳。使用 torchvision(0.18.1 版)进行的中等幅度数据增强包括随机旋转、水平及垂直翻转、颜色抖动(transforms.ColorJitter(brightness=0.1, contrast=0.1, saturation=0.1, hue=0.02)),以及其他小幅度几何增强(transforms.RandomAffine(0, translate=(0.05, 0.05), scale=(0.95, 1.05), shear=10))。此外,将弥漫斑区分为淡染和浓染两类并未降低性能,而是获得相同或更佳的总体性能。使用验证集预选三个候选模型后,选择在留出测试集中性能最高的模型作为最终模型(表 3)。该模型以 24 的批量大小训练 56 轮,采用中等幅度数据增强、最佳学习率,并区分六个类别。
代码和模型,包括 ilastik 随机森林像素分类器及用于沉积物分类的卷积神经网络参数,已在 GitHub 上公开(https://github.com/cor2ni/Abeta_histo_classifier)。
统计分析
采用 Kruskal–Wallis 检验和 Dunn 事后分析,并使用 FDR Benjamini–Hochberg 法校正多重检验,比较各脑区沉积物的绝对负荷和各类别比例。为评估受试者之间区域取样不均衡的影响,即并非每名受试者的所有脑区均具有可用的 Aβ 染色,我们引入了一个称为完整子集的变量,包含在九个选定脑区(额叶、枕叶、海马及小脑区域)完成染色的 40 名受试者。在该完整子集中重复进行 Kruskal–Wallis 检验及经 FDR 校正的 Dunn 事后分析。此外,在完整子集中进行经 FDR 校正的 Wilcoxon 符号秩检验,以考虑按患者 ID 配对的测量。进一步对这九个脑区分别建立多元线性回归模型:以斑块总计数、各类别斑块绝对计数和相对计数为因变量;以完整子集为自变量;以死亡年龄、性别和 ApoE 基因型为协变量。借此评估该完整子集是否与总体队列表现不同。
为考察皮质各区中沉积物类别之间的相关性,先通过线性回归控制脑区固有差异,再使用 Pearson 相关分析,将各类别的绝对负荷和百分比负荷与同一区域的 Aβ 沉积物总体负荷进行相关分析,并随后进行 FDR 校正。为校正患者内依赖性,在对照分析的线性回归模型中,除脑区外还纳入患者 ID。重复整个流程,将各类别的绝对负荷和百分比负荷与其他类别的绝对负荷和百分比负荷进行相关分析。相应结果以热图展示。为提供脑区特异性的可视化示例,采用 Pearson 相关分析,考察额中回 Aβ 沉积物各类别绝对量和相对量之间的相关性,并以散点图展示。重复这一方法,分析皮质各区 Aβ 类别与内嗅皮质 tau 覆盖面积的相关性,以热图展示;并分析额中回 Aβ 类别与内嗅皮质 tau 覆盖面积的相关性,以散点图展示。
为研究 Aβ 沉积物类别与潜在预测变量或受影响变量之间的关联,在皮质各区应用多元线性回归模型。具体而言,以各沉积物类别的绝对(或相对)负荷为因变量。关注的自变量包括:作为 tau 指标的 Braak 和 Braak 分期(额外校正死亡年龄、性别及 ApoE 基因型)、α-syn 共病理(额外校正死亡年龄、性别及 ApoE 基因型)、TDP43 共病理(额外校正死亡年龄、性别及 ApoE 基因型)、性别(额外校正死亡年龄及 ApoE 基因型)、ApoE 基因型(额外校正死亡年龄及性别)、遗传性 AD(额外校正性别及 ApoE 基因型)、临床起病年龄(额外校正性别及 ApoE 基因型)、病程(额外校正死亡年龄、性别及 ApoE 基因型)以及死亡年龄(额外校正性别及 ApoE 基因型)。此外,所有模型均将脑区名称作为分类协变量纳入,以校正脑区差异。对每个自变量比较,分别使用 FDR Benjamini–Hochberg 法对多重检验的 P 值进行校正。作为患者内依赖性的对照分析,将上述回归模型改为以患者 ID 为随机效应的线性混合效应模型,重复分析。然而,经后续 FDR 校正后,不再有显著结果,提示可能存在过度校正。因此,为避免增加论文的阅读难度,下文仅报告线性回归模型的结果。
为在单次分析中整合多个因素,构建线性混合效应模型,以各类别的沉积物数/mm2 为因变量,以脑区、性别、ApoE4 状态、起病年龄及病程为自变量,以患者 ID 为随机效应:
沉积物类别 x ~ C(脑区) + C(性别) + C(ApoE4) + 起病年龄 + 病程 + (1 | 患者 ID)。
分类变量以 C() 表示。采用 FDR Benjamini–Hochberg 法,对所有线性混合效应模型的多重检验 P 值进行校正。此外,对若干示例脑区建立多元线性回归模型,以各类别沉积物密度为因变量,以性别、ApoE4 状态、起病年龄及病程为自变量。所有分析的显著性水平设为 p < 0.05(*)、p < 0.01(**)和 p < 0.001(***)。绘图及统计分析使用 Python(3.10.12 版)完成。
结果
通过对 84 名个体、每例最多 23 个脑区的 Aβ 沉积物进行自动定量和分类,我们解析了阿尔茨海默病(AD)病例之间 Aβ 病理的共性与异质性。共从 1179 个标注区域的免疫组织化学染色图像中提取 57,233 个 Aβ 沉积物,并使用卷积神经网络(CNN)将其分配至六类(核心斑、淡染弥漫斑、浓染弥漫斑、致密斑、CAA、小致密斑)。
读者解释结果时应考虑该数据集因自愿脑捐献而存在的招募偏倚(表 1)。由于家族性 AD 病例占 29%,队列的平均临床起病年龄为 61.6 ± 12.2 岁,平均死亡年龄为 73.9 ± 11.4 岁。队列中 55% 为女性。所有病例临床上均表现为痴呆。多数病例处于较高的 Braak 和 Braak 分期(V 或 VI 期)及 Thal 分期 5 期。为给未来研究的相关分析提供合理模板,同时出于数据保护要求避免披露个体数据,表 S19 提供了各脑区及各亚队列每 mm2 的 Aβ 沉积物计数。相应列名的解释见表 S18。
Aβ 沉积物分类器的性能
将 Aβ 沉积物分为六类(图 2),是在可区分类别尽可能多与各类别出现频率足够高之间的折中。核心斑和 CAA 为公认类别,而弥漫斑进一步细分为淡染弥漫斑和浓染弥漫斑。致密斑与较少见的粗颗粒斑及棉絮斑合并。小致密斑涵盖其余沉积物。各类别与既往文献的对应关系将在讨论中阐述。为使计算工作量保持合理,排除了最小的(< 100 µm2)Aβ 对象。为实现 Aβ 沉积物的标准化、大规模定量分类,训练并优化了卷积神经网络(图 S3),将输入图像分配至六类。模型使用 2135 张图像训练,533 张图像验证,并在由 471 张人工分类图像组成的留出测试集上测试。
在测试集中,模型取得了较高的召回率 81.5%(真阳性 /(真阳性 + 假阴性))和较高的精确率 82.4%(真阳性 /(真阳性 + 假阳性))(表 3)。淡染弥漫斑、CAA 和小致密斑这三类的召回率均超过 85%。浓染弥漫斑和致密斑在多数情况下分类正确,召回率分别为 71.9% 和 67.2%。核心斑召回率最低,为 62.5%,多数错误预测被归为浓染弥漫性沉积物。小致密沉积物(94.1%)和淡染弥漫性沉积物(88.6%)的精确率最高,它们也是最常见的沉积物。模型对 CAA(80.3%)、致密斑(78.2%)和浓染弥漫斑(67.6%)的精确率为中等偏高。核心斑在测试集中的检测精确率相对较低,为 46.9%。为改善核心斑和 CAA 这两个最小类别较低的精确率,由一名评估者(AN)对所有被分为核心斑或 CAA 的沉积物进行目视检查,并根据需要重新分类。其中,2955 个被标为核心斑的沉积物中有 68.7% 被人工重新分配至其他类别,2276 个被标为 CAA 的沉积物中有 82.7% 被重新分配至其他类别(图 S4)。与测试集相比,精确率的差异可能源于实际应用数据集中核心斑和 CAA 所占比例更低,以及部分沉积物的形态难以分类。这些结果强调了对本模型预测为核心斑和 CAA 的对象进行人工核验的重要性;其他类别数量显著更多,因此在大规模应用中更为稳健。此外,只有当核心位于切面内时才能可靠识别核心斑,这是二维方法的局限,会导致对此类斑块的总体低估。部分类别之间的精确率可能也反映了形态的模糊性。总体而言,在部分人工辅助下,该模型能够对大型数据集进行可靠且符合实际的分类。所提出的卷积神经网络的优势在于可区分六类,且所有检测到的沉积物均可归入这些类别。
Aβ 沉积的脑区差异
多数皮质脑区的沉积物计数相对较高(中位数从岛叶皮质的 81/mm2 至额叶脑沟的 104/mm2),而枕叶脑回和脑沟、海马旁皮质及内嗅皮质的沉积物计数显著较低(中位数范围从内嗅皮质的 28/mm2 至枕叶脑沟的 50/mm2)(图 3a、S6,表 S2)。使用 Kruskal–Wallis 检验和 Dunn 事后分析,并进行 FDR 多重检验校正,比较各脑区(表 S4),发现皮质脑区的 Aβ 沉积物总计数大多显著高于皮质下、海马及小脑区域(中位数范围从小脑齿状核的 0/mm2 至壳核的 49/mm2)。在具有九个完整取样区域的 40 例子集中,使用 Kruskal–Wallis 检验和 Dunn 事后分析,或 Wilcoxon 符号秩检验并随后进行 FDR 校正,总体分布仍保持不变(图 S5,表 S11),限制了潜在取样偏倚的影响。此外,在相同九个脑区中,采用多元线性回归并校正死亡年龄、性别和 ApoE,比较完整子集(因两例元数据缺失而包含 38 例)与整个队列的斑块总密度和各类别密度。FDR 校正后无显著差异,支持该队列具有代表性。这些结果提示,Aβ 沉积在皮质脑区最高,且负荷相对均一,仅枕叶或内嗅区域的数值较低。皮质下、海马及小脑区域受累较轻,提示这些区域可能承受较少的应激因素、存在使其免于受累的机制,或具有更多防止 Aβ 沉积的保护因素。
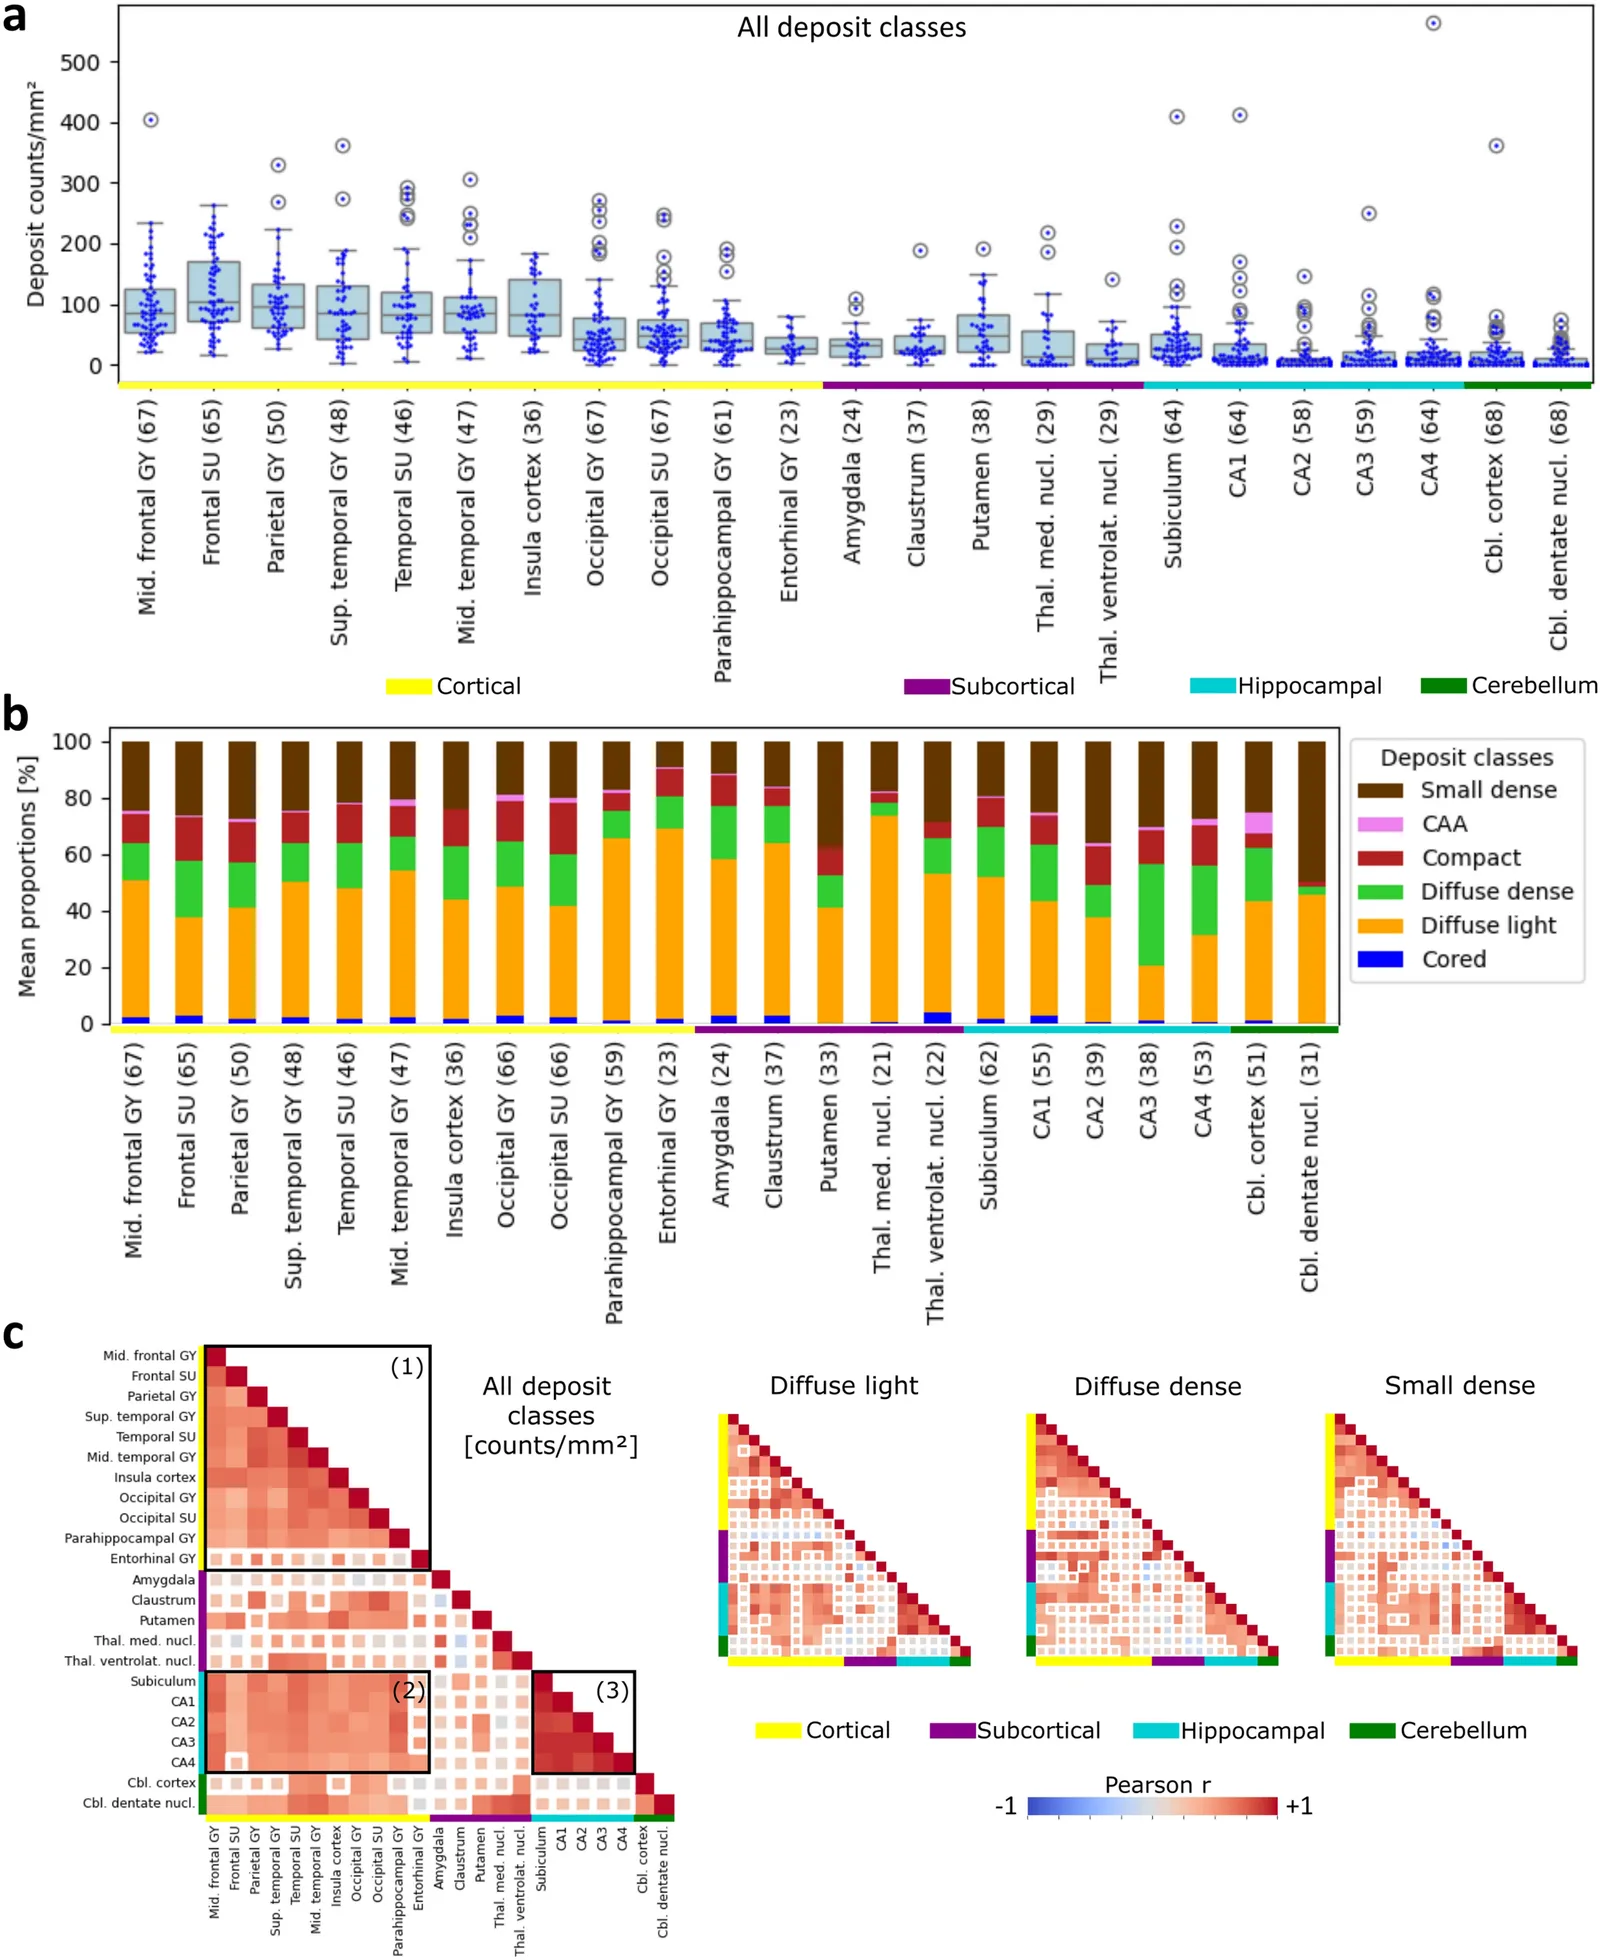
第二步,比较各脑区中每类沉积物占该脑区 Aβ 沉积物总数的比例负荷(图 3b,表 S3)。淡染弥漫斑在多数脑区占主导(中位数范围从海马 CA3 区的 12% 至丘脑内侧核的 78%)。在多数脑区,小致密斑居第二,浓染弥漫斑居第三。致密斑居第四。总体上,核心斑和 CAA 在各脑区所占比例均较低,中位百分比约为 0%。这些结果提示,很大一部分斑块属于分化不明显的弥漫性沉积物,且常较小。相比之下,属于 CAA、致密斑或核心斑等特定类别的沉积物相对较少。在不同脑区间,皮质脑区的核心斑和致密斑比例倾向于高于非皮质脑区(表 S5、S8)。淡染弥漫斑在海马旁皮质、内嗅皮质和丘脑内侧核尤占优势,而在海马 CA3 和 CA4 区比例相对较低(表 S6)。额叶和枕叶脑沟皮质的 CAA 比例较高(表 S9)。内嗅皮质的小致密斑比例相对较低(表 S10)。这些结果与九个脑区完整数据子集的结果大体一致,其中 Kruskal–Wallis 检验结合 Dunn 事后分析与 Wilcoxon 符号秩检验的结果大多相似(表 S12–17)。采用多元线性回归,比较整个队列与完整子集的沉积物相对密度;由于元数据不完整,或九个脑区中一个或多个脑区未检测到沉积物,该子集由 14 例组成。在 FDR 校正前后均无显著差异,同样限制了取样造成潜在偏倚的可能性。
为评估脑区间 Aβ 负荷是否相关,对 23 个脑区的斑块总计数进行 Pearson 相关分析,并随后采用 FDR 法校正多重检验(图 3c、S7、S8)。除内嗅皮质外,所有皮质脑区的 Aβ 沉积物计数均呈正相关;内嗅皮质的例外情况部分源于该区可用染色较少(图 S8)。海马各区内部以及海马与皮质脑区之间也存在高度正相关。未观察到脑区 Aβ 负荷之间显著的负相关。在分析各特定沉积物类别的 Aβ 负荷在脑区间的相关性时(图 3c、S9),上述三组正相关脑区组合,即皮质各区、海马各区及两者之间的组合,在淡染弥漫斑、浓染弥漫斑和小致密斑中也很明显。CAA、致密斑或核心斑密度在脑区间出现显著正相关的情况较少。
Aβ 沉积物之间的相关性
接下来,采用 Pearson 相关分析,考察各脑区中单个沉积物类别的计数与同一脑区所有沉积物绝对计数之间的相关性。分析在皮质各区进行,先通过回归校正脑区名称,再进行 FDR 校正(图 4a、S12);同时,为便于可视化,单独分析额中回(MFG)(图 4b)。在皮质各区及额中回中,斑块绝对总计数与淡染弥漫斑(皮质各区:r=0.76,p<0.001;MFG:r=0.74,p<0.01)和小致密斑(皮质各区:r=0.75,p<0.001;MFG:r=0.84,p<0.01)的绝对计数呈高度正相关,与浓染弥漫斑呈中度相关(皮质各区:r=0.69,p<0.001;MFG:r=0.8,p<0.01),与致密斑呈低度相关(皮质各区:r=0.41,p<0.001;MFG:r=0.55,p<0.01)。相比之下,核心斑和 CAA 的密度与 Aβ 斑块总负荷不相关。后者提示核心斑和 CAA 具有特殊作用,其积聚并非简单的线性过程。
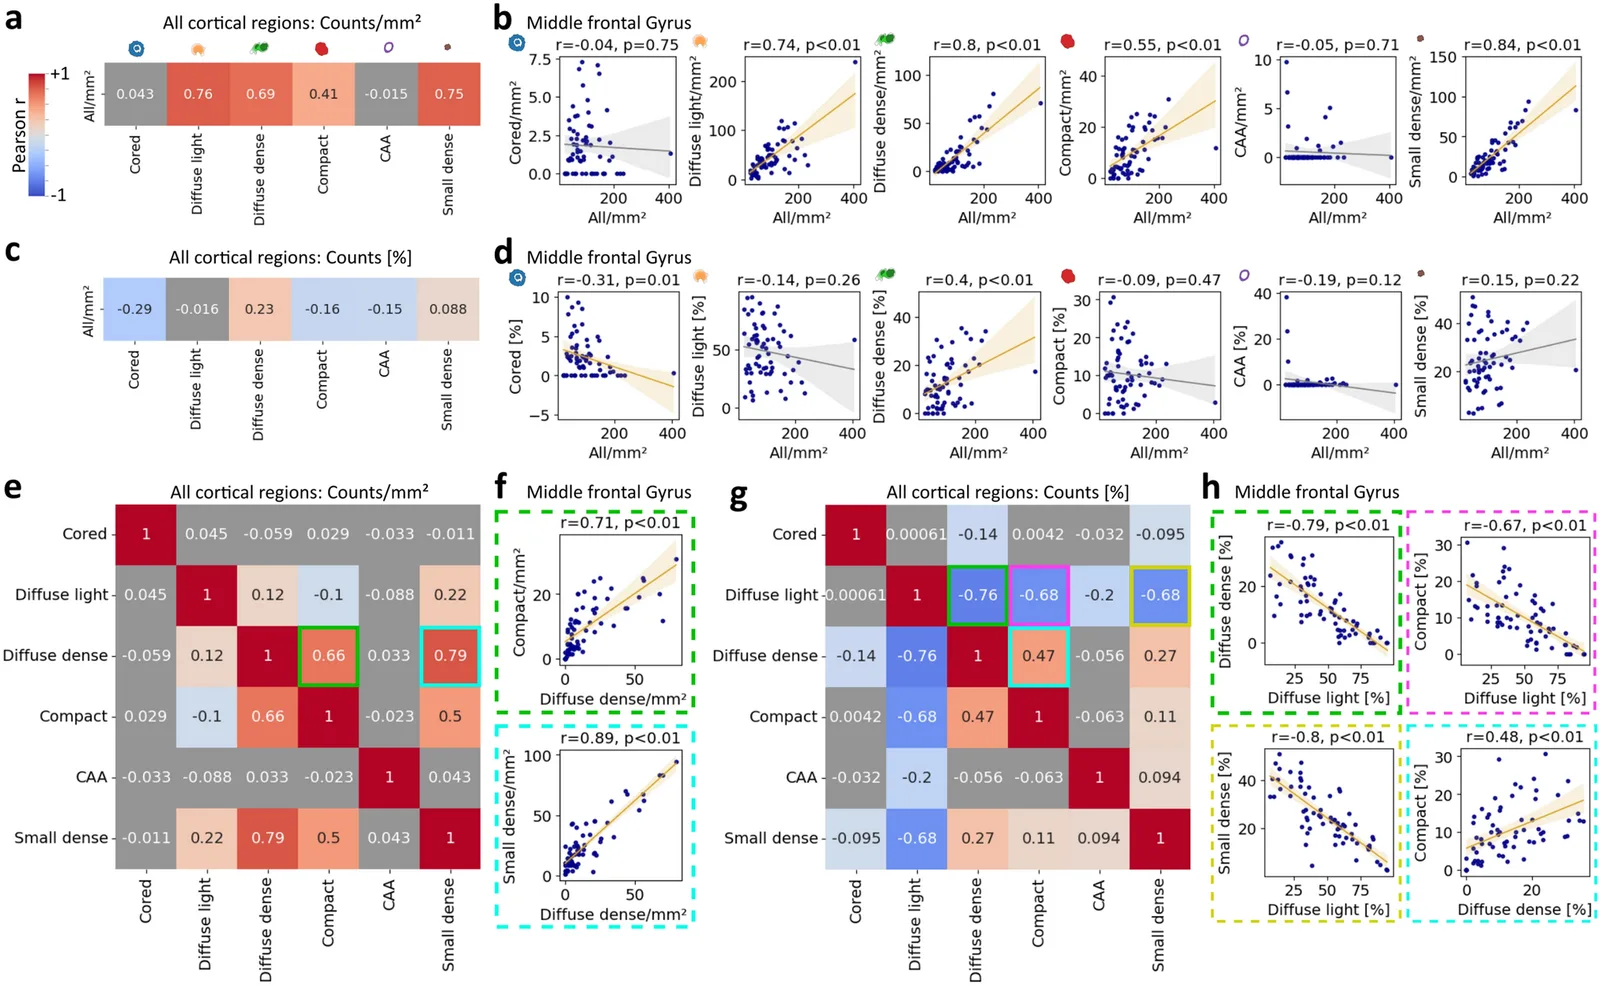
为考察沉积物总计数较高的病例是否具有不同的类别组成,以斑块相对计数替代绝对计数,重复上述分析(图 4c 和 d)。随着斑块总计数增加,皮质各区浓染弥漫斑(皮质各区:r=0.23,p<0.001;MFG:r=0.4,p<0.01)和小致密斑(皮质各区:r=0.088,p=0.043)的比例呈弱幅增加,而核心斑(皮质各区:r=− 0.29,p<0.001;MFG:r=−0.31,p=0.01)、致密斑(皮质各区:r=−0.16,p<0.001)以及 CAA(皮质各区:r=−0.15,p=0.001)的比例呈弱负相关。考虑到所有纳入病例均存在晚期 AD 相关病理改变和痴呆,这些发现表明,浓染弥漫斑可在死亡前广泛积聚,而核心斑、致密斑和 CAA 的密度并未以相同程度增加。
作为总体沉积物负荷的另一种度量,我们分析了各沉积物类别的绝对负荷和比例负荷与同一皮质脑区 Aβ 覆盖面积的相关性(图 S14)。结果与上述采用沉积物计数/mm2 所得到的发现大体一致。浓染弥漫斑与 Aβ 覆盖面积之间特别强的相关性值得关注(皮质各区:r=0.78,p<0.001;MFG:r=0.86,p<0.01),提示在 Aβ 严重受累的 AD 病例中,增加的尤其是浓染弥漫斑的数量。
此外,通过线性回归校正各脑区后,采用 Pearson 相关分析和 FDR 校正,考察皮质各区沉积物类别密度之间的相关性。总体热图及额中回散点图示例见图 4e 和 f。特别值得注意的是,浓染弥漫斑与小致密斑(皮质各区:r=0.79,p<0.001;MFG:r=0.89,p<0.01),以及浓染弥漫斑与致密斑(皮质各区:r=0.66,p<0.001;MFG:r=0.71,p<0.01)呈中至高度正相关,提示它们不仅在图像形态上存在重叠,也可能在相同条件下形成。淡染弥漫斑与小致密斑(皮质各区:r=0.22,p<0.001)及浓染弥漫斑(皮质各区:r=0.12,p=0.012)呈轻度正相关。淡染弥漫斑与致密斑之间存在弱负相关(皮质各区:r=−0.1,p=0.037),提示病例倾向于向其中一个方向发展。
为考察校正沉积物总计数后各沉积物类别之间的关联,采用斑块相对计数重复相关分析(图 4g 和 h)。与此前相同,浓染弥漫斑与致密斑(皮质各区:r=0.47,p<0.001;MFG:r=0.48,p<0.01),以及浓染弥漫斑与小致密斑(皮质各区:r=0.27,p<0.001)之间仍呈正相关,但相关性较弱。该分析进一步突出显示,淡染弥漫斑与浓染弥漫斑(皮质各区:r=− 0.76,p<0.001;MFG:r=−0.79,p<0.01)、致密斑(皮质各区:r=− 0.68,p<0.001;MFG:r=− 0.67,p<0.01)、小致密斑(皮质各区:r=−0.68,p<0.001;MFG:r=−0.8,p<0.01)以及 CAA(皮质各区:r=−0.2,p<0.001)之间呈负相关。这些发现提示,不同机制分别促成皮质内淡染弥漫性 Aβ 沉积,或形成染色更浓、更致密的沉积物,但这些机制独立于核心斑。在上述分析中通过线性回归纳入患者 ID 后,Pearson 相关系数略有降低;但总体结果仍相近(图 S13)。
Aβ 沉积物与 tau 及共病理的关联
为考察特定 Aβ 斑块是否与总体 tau 负荷指标的程度相关,在皮质各区分析了各 Aβ 沉积物类别的绝对计数/mm2 与内嗅皮质 tau 覆盖面积百分比之间的关联(图 5a,图 S15)。先通过线性回归按各脑区校正 Aβ 数值,再采用 Pearson 相关分析和 FDR 校正,考察 Aβ 类别计数与 tau 面积比例之间的相关性。仅核心斑与内嗅皮质 tau 呈显著正相关(r=0.11,p=0.034)。内嗅皮质 tau 负荷与皮质各区的淡染弥漫斑(r=−0.15,p=0.006)、浓染弥漫斑(r=−0.23,p<0.001)、致密斑(r=−0.14,p=0.01)和小致密斑(r=−0.17,p=0.002)均呈显著负相关。未观察到 CAA/mm2 与内嗅皮质 tau 覆盖面积之间存在相关性。通过线性回归额外校正患者 ID 后,未得到显著结果(图 S13)。将皮质各区 Aβ 斑块的百分比负荷与内嗅皮质 tau 负荷进行相关分析,发现核心斑呈显著正相关(r=0.14,p=0.027),浓染弥漫斑呈显著负相关(r=− 0.12,p=0.049)。总体而言,这些结果提示,核心斑更可能与较高的内嗅皮质 tau 负荷相关,而其他斑块类别在 tau 负荷较低时积聚更多。
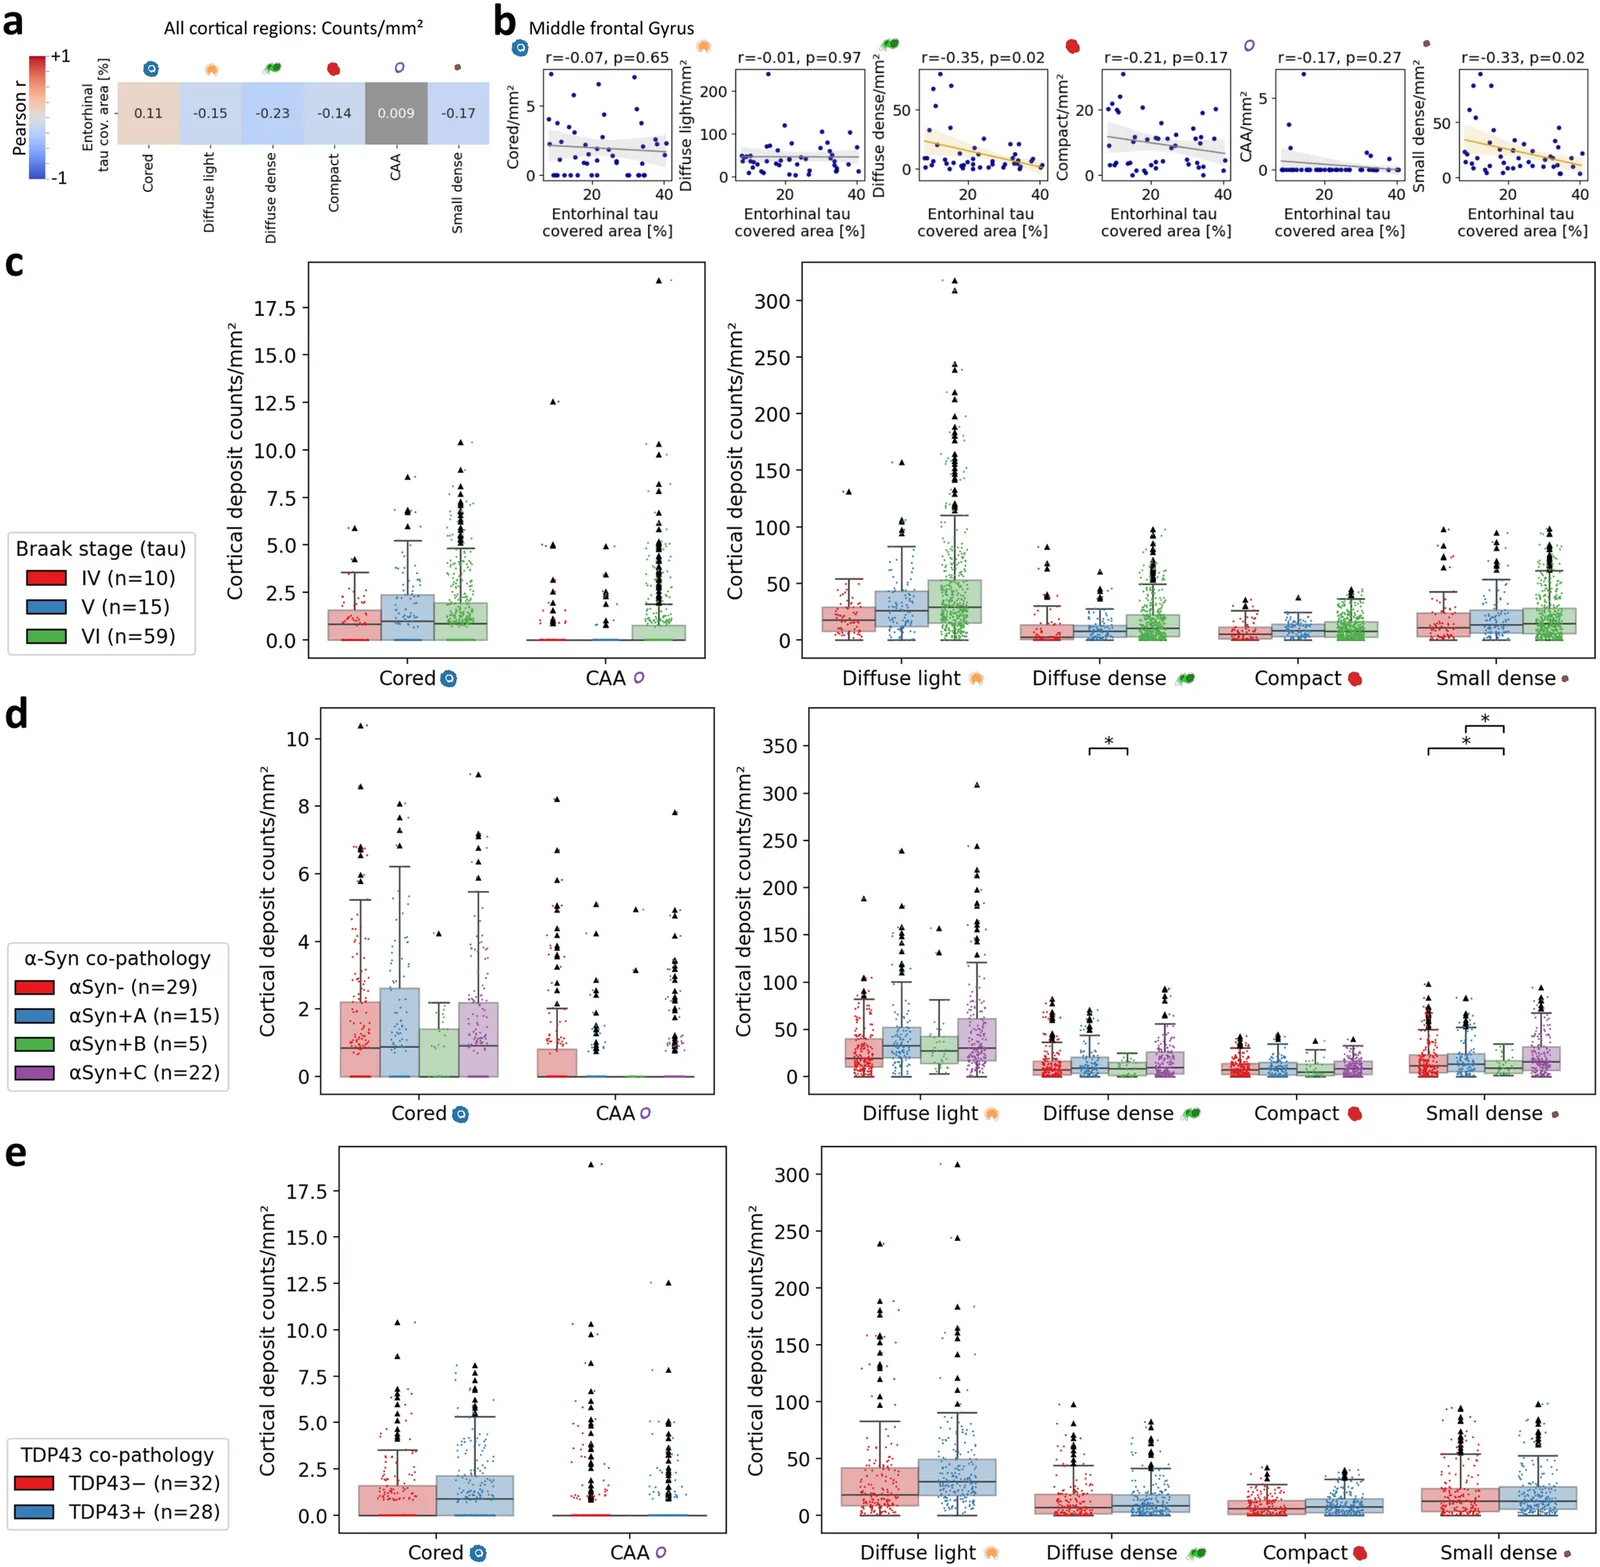
为检验 Aβ 与 tau 在同一皮质脑区内是否相关,对 Aβ 沉积物密度与同一脑区 tau 覆盖面积进行 Pearson 相关分析(图 S16 和 S17)。除少数例外,包括枕叶皮质的若干 Aβ 沉积物类别呈弱正相关外,Aβ 各类别与局部 tau 负荷大多不相关。这一发现提示,tau 与 Aβ 之间可能几乎不存在直接的局部联系。
为考察 Aβ 沉积物密度与作为 tau 指标的 Braak 和 Braak 分期之间的关联,我们采用两两比较的多元线性回归模型,校正 ApoE 基因型、年龄、性别和脑区名称(图 5c,图 S15)。Braak 和 Braak 分期 IV 至 VI 期之间的斑块负荷相近,FDR 校正后无显著差异。在 FDR 校正前,与 IV 期(β=0.87,p未校正 FDR=0.008,pFDR=0.05)和 VI 期(β=−0.46,p未校正 FDR=0.029,pFDR=0.11)相比,Braak 和 Braak 分期 V 期组的核心斑密度呈增加趋势。此外,Braak 和 Braak 分期 VI 期的浓染弥漫斑负荷呈增加趋势(与 IV 期相比:β=2.86,p未校正 FDR=0.015,pFDR=0.07;与 V 期相比:β=4.87,p未校正 FDR=0.008,pFDR=0.05),Braak 分期 VI 期的 CAA 密度较 V 期也呈增加趋势(β=0.51,p未校正 FDR=0.006,pFDR=0.05)。就斑块比例负荷而言,Braak 和 Braak 分期 VI 期与浓染弥漫斑比例增加(与 IV 期相比:β=2.3,pFDR=0.03)及小致密斑比例降低(与 IV 期相比:β=−2.4,pFDR=0.03)相关。这些发现提示,随着 Braak 和 Braak 分期升高,Aβ 沉积物负荷有轻度增加趋势,浓染弥漫斑比例也倾向升高,而皮质浓染弥漫斑密度与内嗅皮质 tau 负荷呈负相关。因此,较高的 Braak 和 Braak 分期不应等同于较高的内嗅皮质 tau 负荷,提示其中存在更细致的差别。
为检验 α-syn 共病理分布组,即 α-syn 阴性、杏仁核为主、脑干为主以及皮质播散性 α-syn 病理各组的皮质 Aβ 类别负荷是否不同,采用两两比较的多元线性回归模型,校正 ApoE 基因型、年龄、性别和脑区名称(图 5c,图 S15)。各组斑块负荷大多相近。经 FDR 多重检验校正后,三项组间差异仍显著:脑干为主的 α-syn 共病理病例,其浓染弥漫斑(β=−9.0,p=0.017)和小致密斑(β=−11.7,p=0.011)密度低于杏仁核为主的病例;后一项发现也适用于 α-syn 阴性病例,其小致密斑数量高于脑干为主的 α-syn 阳性组(β=−5.1,p=0.017)。这些发现提示,α-syn 脑干组的致密 Aβ 沉积有所不同。就百分比负荷而言,杏仁核为主的 α-syn 病例中,小致密斑比例显著低于 α-syn 阴性病例(β=−4.9,p=0.042)或皮质 α-syn 阳性病例(β=2.25,p=0.042)。总体上,我们未发现 α-syn 共病理与不同 Aβ 斑块类别之间存在强关联。
采用多元线性回归,校正脑区名称、ApoE 基因型、性别和死亡年龄后,比较伴与不伴 TDP43 共病理的 AD 病例(图 5e,图 S15)。在有可用组织的情况下,检查海马、杏仁核和延髓中的 TDP43 沉积。TDP43 阳性病例的 CAA 和小致密斑密度较低,但 FDR 校正后未达到显著性。比较 Aβ 类别比例,TDP43 阳性病例中淡染弥漫斑比例升高(β=11.0,p=0.001),小致密斑(β=−2.6,p=0.001)和 CAA(β=−6.1,p<0.001)比例降低。这些发现提示淡染弥漫性 Aβ 斑块与 TDP43 沉积物相关,可能源于受损的蛋白降解与清除通路存在重叠。在无 TDP43 沉积的病例中,小致密斑和 CAA 所占比例更高。
Aβ 沉积物与性别及基因型的关联
在多元线性回归模型中校正死亡年龄、ApoE 基因型及脑区名称后(图 6a,图 S18),女性病例的淡染弥漫性(β=−17.3,p<0.001)、浓染弥漫性(β=−6.1,p<0.001)、致密性(β=−2.2,p=0.007)和小致密性沉积物(β=−6.1,p<0.001)绝对密度均显著更高,但出乎意料的是,核心斑和 CAA 的计数相同。由于绝对值的差异改变了比例,男性的核心斑比例显著更高(β=0.67,p=0.046),浓染弥漫斑比例更低(β=−3.0,p=0.024)。这些发现表明,女性总体上积聚了更高的 Aβ 斑块负荷,但核心斑除外;在该晚期 AD 病例队列中,核心斑未显示性别倾向。
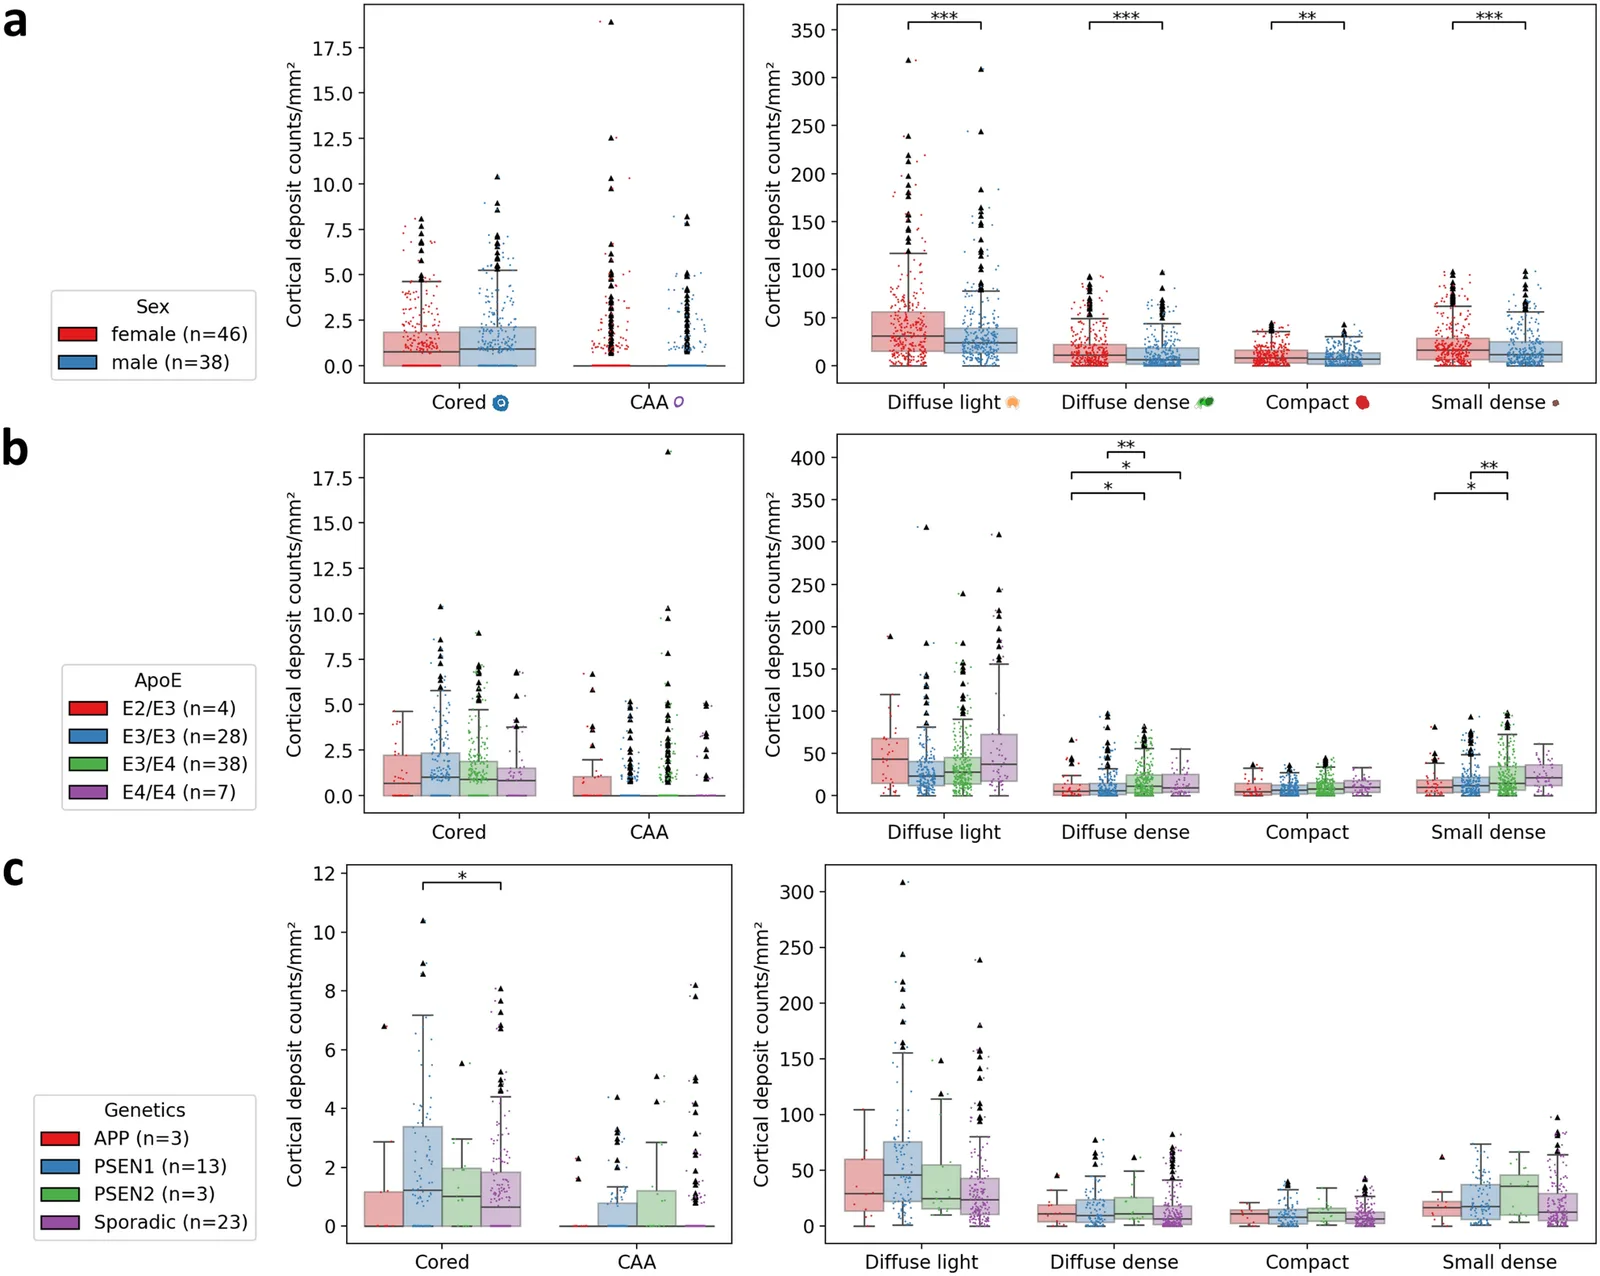
为研究 ApoE 基因型对皮质 Aβ 沉积物类别的影响,采用两两比较的多元线性回归,校正死亡年龄、性别和脑区名称后,比较不同 ApoE 基因型(E2/E3、E3/E3、E3/E4、E4/E4)中各沉积物类别的绝对量和相对量(图 6b,图 S18)。与不携带 E4 的病例相比,至少携带一个 E4 等位基因的病例中,浓染弥漫斑和小致密斑的密度显著更高。致密斑及部分淡染弥漫斑也呈相同趋势,但未达到显著性。核心斑未见差异,其统计分析受到密度较低和方法学限制的影响。携带 E2 等位基因的病例存在 CAA 更多的非显著趋势(E2/E3 与 E3/E3 比较:β=−0.40,p未校正 FDR=0.06,pFDR=0.16)。比较各 ApoE 基因型的沉积物计数比例,E2/E3 组合的病例较 E3/E4 基因型 AD 病例具有更高的淡染弥漫性沉积物比例(β=−8.3,p=0.018)和更低的小致密沉积物比例(β=4.0,p=0.018)。这些结果提示,ApoE 基因型部分影响 Aβ 斑块组成,携带 E4 等位基因的病例倾向于形成更多致密沉积物。
为考察特定 AD 相关突变对皮质 Aβ 斑块类别的影响,采用多元线性回归,校正 ApoE 基因型、性别和脑区名称后,对携带 APP、PSEN1 或 PSEN2 突变的病例及散发性病例进行两两比较(图 6c,图 S18)。本分析中,散发性病例定义为报告的起病年龄 >65 岁,且全基因组测序未发现明显 AD 相关变异的 AD 病例。经 FDR 多重检验校正后,仅一项差异仍显著:PSEN1 突变携带者的核心斑绝对数量多于散发性 AD 病例(β=−0.48,p=0.019)。未进行 FDR 校正时,PSEN2 突变病例的淡染弥漫性沉积物计数略高于散发性病例(β=−24.8,p未校正 FDR=0.005,pFDR=0.10),浓染弥漫斑多于 PSEN1 突变携带者(β=7.8,p未校正 FDR=0.046,pFDR=0.25),致密斑多于 PSEN1 突变携带者(β=4.28,p未校正 FDR=0.045,pFDR=0.25),小致密斑也多于 PSEN1 突变携带者(β=10.7,p未校正 FDR=0.031,pFDR=0.25);但 PSEN2 携带者数量有限,仅三例。总体而言,这些发现提示 PSEN1 突变与更多核心型 Aβ 斑块相关。由于病例数较少,尚不宜对 PSEN2 作出结论。
Aβ 沉积物与起病年龄、病程及死亡年龄的关联
采用多元线性回归,校正 ApoE 基因型、性别和脑区名称后,比较三个临床起病年龄组(< 65 岁、65–74 岁及 ≥75 岁)的斑块密度(图 7a,图 S19)。起病年龄 ≥75 岁的最高龄组较中间年龄组(65–74 岁)有核心斑更少的趋势(β=−0.68,p未校正 FDR=0.014,pFDR=0.25),较最年轻组(< 65 岁)有浓染弥漫斑更少的趋势(β=−2.46,p未校正 FDR=0.032,pFDR=0.25)。就 Aβ 沉积物比例负荷而言,最年轻组(< 65 岁)的淡染弥漫斑负荷显著高于中间年龄组(65–74 岁)(β=−7.4,p=0.013),小致密斑少于中间年龄组(β=5.9,p<0.001)及最高龄组(≥ 75 岁)(β=3.3,p<0.001)。这些发现提示核心斑及更多的淡染弥漫斑与较年轻的起病年龄相关,但应考虑到队列包含家族性 AD 病例。
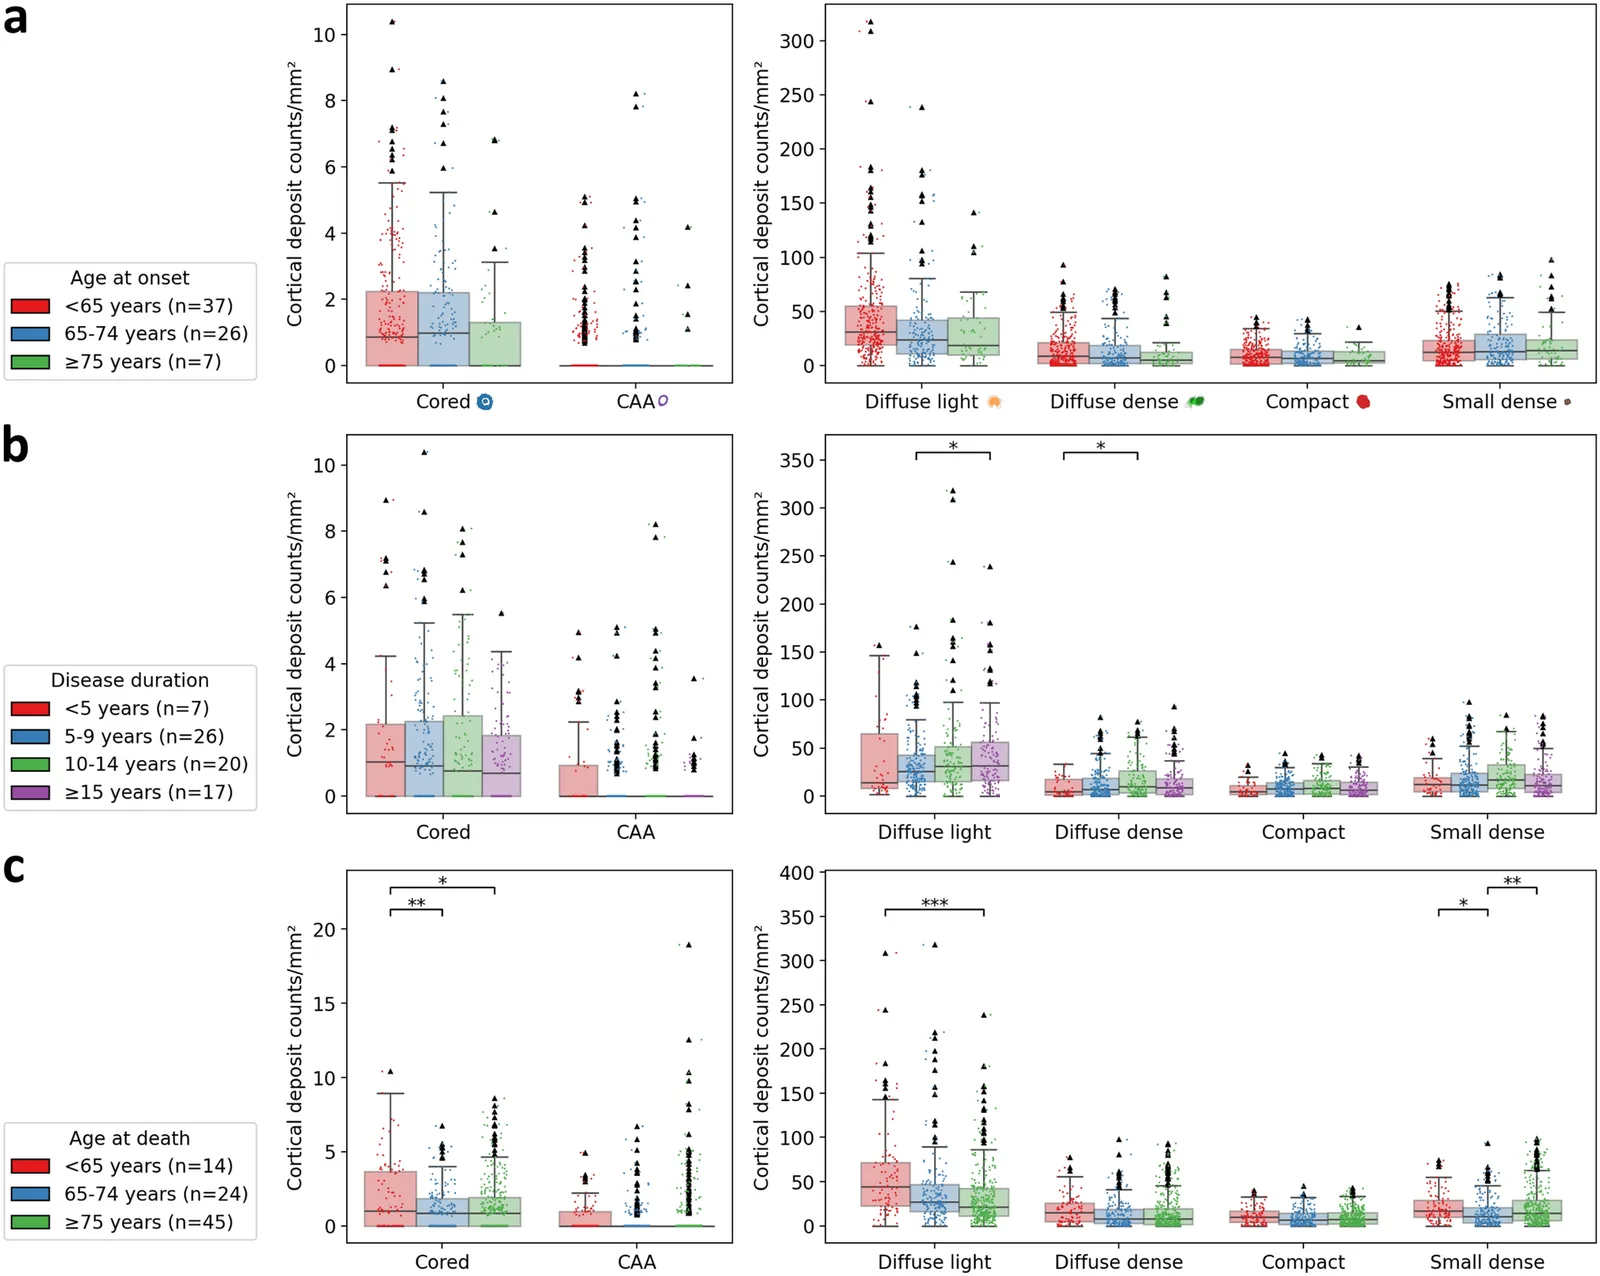
为估计病程与皮质 Aβ 沉积之间的关联,比较四个组(< 5 年、5–9 年、10–14 年、≥15 年)中各沉积物类别的绝对量和相对量。多元线性回归模型校正了死亡年龄、性别、ApoE 基因型和脑区名称(图 7b,图 S19)。较长病程(≥ 15 年)与较病程 5–9 年更高的淡染弥漫斑绝对计数相关(β=6.4,p=0.040)。10–14 年的较长病程与较 <5 年更高的浓染弥漫斑计数相关(β=5.2,p=0.026)。这些结果提示弥漫斑随痴呆持续时间延长而积聚。各病程组的核心斑、CAA、致密斑和小致密斑相近。比较各类别比例,短病程(< 5 年)与较长病程(≥ 15 年)更高的核心斑比例显著相关(β=−0.57,p=0.016),且与较病程 5–9 年(β=−1.21,p=0.039)及 ≥15 年(β=−0.62,p=0.016)更高的 CAA 比例显著相关。随着病程延长,淡染弥漫性和浓染弥漫性沉积物比例主要呈增加趋势,而致密斑和小致密斑比例倾向于降低。尽管病程估计部分具有主观性,这些发现提示,淡染弥漫斑和浓染弥漫斑可随时间显著积聚,而不立即产生限制寿命的作用。相比之下,病程较短的病例也有相同数量的核心斑和 CAA,因此二者可能对临床疾病进展至关重要。
为评估死亡年龄与 Aβ 斑块负荷之间的关系,在皮质各区采用多元线性回归,校正性别、ApoE 基因型和脑区名称后,比较三个年龄组(< 65 岁、65–74 岁、≥75 岁)中各沉积物类别的绝对量和相对量(图 7c,图 S19)。值得注意的是,年轻死亡年龄(< 65 岁)与较中间年龄组 65–74 岁(β=−0.88,p=0.0025)及高龄组 ≥75 岁(β=−0.34,p=0.019)更高的核心斑绝对数量显著相关。此外,<65 岁患者的淡染弥漫性沉积物负荷高于 ≥75 岁患者(β=− 11.6,p<0.001)。就小致密斑而言,中间组(65–74 岁)的密度低于较年轻组(< 65 岁)(β=−5.4,p=0.043)及较高龄组(≥ 75 岁)(β=6.0,p=0.005)。在比例层面,最高龄组(≥ 75 岁)的淡染弥漫斑比例显著低于 65–74 岁患者(β=−7.0,p=0.027),小致密斑比例高于 <65 岁组(β=2.7,p=0.003)及 65–74 岁组(β=6.8,p<0.001)。综合而言,这些发现表明,较年轻时死亡的患者在死亡前具有更高的核心型和淡染弥漫性 Aβ 斑块负荷,这可能部分由队列中的家族性 AD 病例解释。
Aβ 沉积决定因素的整合
最后,将性别、ApoE、起病年龄和病程整合至皮质各脑区的线性混合效应模型中,校正脑区并加入个体受试者的随机因素(图 8)。排除元数据不完整的数据点后,本分析每个沉积物类别均纳入来自 64 名患者的 461 项观察。女性与淡染弥漫斑密度增加显著相关(系数 β=−15,p=0.048)。检测到 ApoE4 等位基因与浓染弥漫斑之间的关联,但经 FDR 校正后不再显著(β=5.4,p未校正 FDR=0.040,p=0.10)。较低的起病年龄也提示家族性 AD 病例,其与更高的核心斑(β=−0.02,p=0.048)、淡染弥漫斑(β=−1.2,p<0.001)和 CAA 密度(β=−0.01,p未校正 FDR=0.041,p=0.10)显著相关,但后者在 FDR 校正后不再显著。较短病程与较高 CAA 密度相关,但该关联在 FDR 校正后也不再显著(β=−0.02,p未校正 FDR=0.037,p=0.10)。
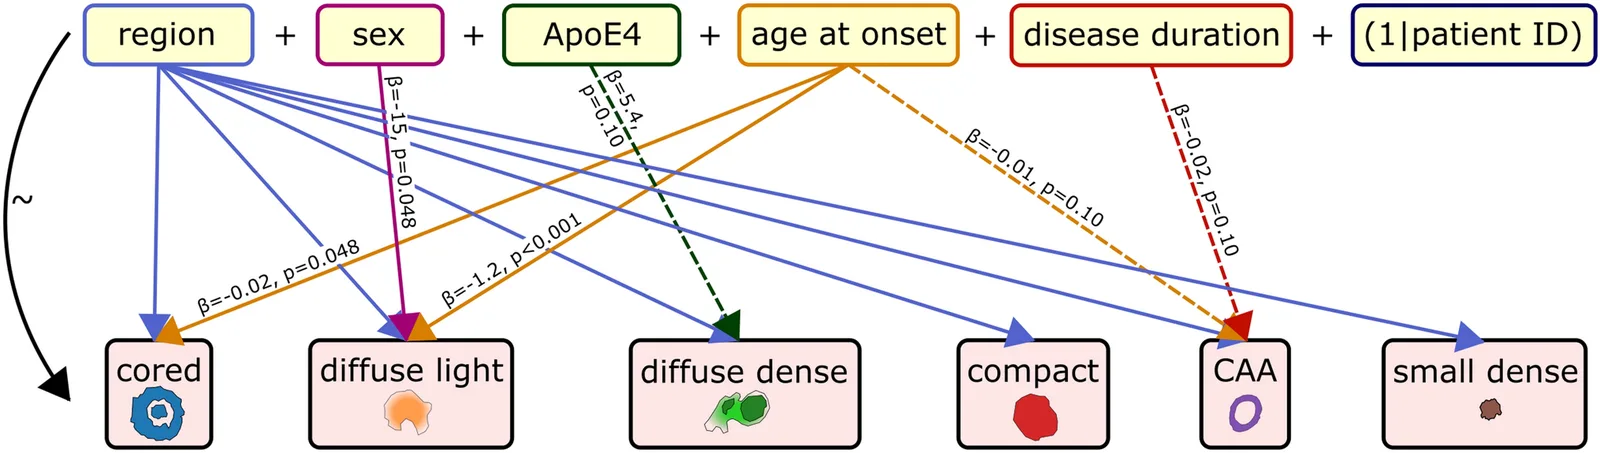
在单个脑区,如额中回、枕叶脑回和脑沟,使用多元线性回归模型重复该分析,部分结果得到重复,而其他相关性有所不同(图 S20)。较年轻的起病年龄与较高的核心斑和淡染弥漫斑密度,以及女性与增加的淡染弥漫斑负荷之间的关联反复出现,而在这些示例脑区中未观察到病程与 CAA 的关系。根据反映模型对因变量方差预测能力的 R2 和调整后 R2 值,性别、ApoE、起病年龄及病程几乎不能解释致密斑或 CAA 的密度(R2adj ≤ 7%),对核心斑密度的解释能力较弱(R2adj 最高为 13%),能够部分解释淡染弥漫斑(R2adj 最高为 37%)、浓染弥漫斑(R2adj 最高为 19%)和小致密斑密度(R2adj 最高为 36%),其中枕叶脑沟的数值最高。
讨论
通过检测 84 例阿尔茨海默病(AD)病例的 Aβ 沉积物,我们使用卷积神经网络成功区分了六种不同的沉积物类别。与皮质下区域较低的负荷相比,皮质区域的 Aβ 负荷较高,且彼此相关。从数量上看,淡染弥漫斑和小致密斑占主导。沉积物、相关因素及决定因素之间的关系复杂,并且在不同沉积物类型和脑区之间并不一致。
Aβ 沉积物分类
基于 3139 个 Aβ 沉积物的人工分类,训练、优化并测试了能够区分六类沉积物的卷积神经网络,在测试集中获得 81.5% 的总体召回率和 82.4% 的精确率。随后对核心斑和 CAA 的预测进行目视核查,确保这两组中无假阳性;与其他类别相比,这两组数量较少,因而精确率容易降低。特殊的棉絮斑 [45] 和粗颗粒斑 [9, 10] 过于少见,无法稳定预测,因此将其归入致密斑类别。
我们的卷积神经网络架构扩展自 Tang 等人 [71] 的模型,该模型将 Aβ 沉积物分为弥漫斑、核心斑和 CAA,准确率/召回率高达 0.987。应注意,Tang 等人 [71] 的测试集类别不均衡,偏向弥漫斑,因此模型可获得非常高的总体准确率。除增加一个卷积层及使用更大的灰度图像作为输入外,主要改进在于新训练的模型可区分更多类别,从而更好地反映实际情况,涵盖大量不能明确归入核心斑或弥漫斑的沉积物,以及 Tang 等人 [71] 更宽泛地排除的较小沉积物。另一些模型,如 Wong 等人 [89] 的模型,性能与我们的模型相近,但仅限于核心斑和 CAA。Amin 等人 [3] 的模型性能较高,但同样仅限于三类沉积物,不适用于本研究的实际方法。因此,我们的模型性能低于或接近文献中的模型,但通过部分目视核查得到改善,并针对特定数据集和研究问题进行了调整,覆盖广泛的 Aβ 沉积物,因此更接近实际情况。
各脑区的 Aβ 沉积
采用 4G8 抗体克隆染色,对晚期 AD 病例各脑区的 Aβ 斑块进行定量。Aβ 负荷在额叶、顶叶、颞叶和岛叶皮质最高,在枕叶、海马旁及内嗅皮质,以及皮质下、海马和小脑区域较低。这些发现与文献一致,并符合 Thal 分期所示的进展,即从新皮质的大量沉积,发展至较晚且受累较轻的异型皮质和海马,最后累及小脑 [73]。
有趣的是,杏仁核、海马和内嗅皮质等常受细胞内 tau、α-syn 和 TDP43 病理累及的区域,Aβ 受累却较轻。受 tau 病理影响的投射神经元通过轴突终末释放 Aβ,与其投射目标皮质区域的 Aβ 沉积相关,这可能解释部分病理分布 [13, 14]。释放的 Aβ 肽可扩散至细胞外间隙 [13],随后积聚为寡聚体及更大的聚集物 [38]。同一脑区内 tau 与 Aβ 几乎不存在相关性,这一事实支持了上述理论。为进一步检验该理论,需要针对相互连接的脑区,特别是脑干-皮质轴,开展相关分析。
就皮质各区内部、海马各区内部以及皮质与海马区域之间斑块负荷的正相关而言,关注连接关系同样很有意义。然而,仅凭连接性并不能解释 Aβ 积聚的程度;例如,屏状核和丘脑具有广泛连接,但斑块负荷仅为中等。
在各脑区中,弥漫斑占主导。已知绒毛状弥漫斑可在早期出现 [74]。虽然所占百分比较低,皮质区域仍有致密斑和核心斑较多的趋势。这可能是由于在较早且较重受累的皮质区域中,斑块经历了从弥漫型到“成熟型”的演变,也可能是局部因素增加了 Aβ 负荷及这些形态更明确的斑块类型出现的概率 [72]。核心斑密度与同一脑区的总体 Aβ 斑块密度不相关,提示核心斑具有独立的形成机制。
在下文中,我们将首先讨论各 Aβ 斑块类别最突出的发现,包括与其分别相关的因素。随后,综合讨论可能的决定因素。
核心斑
核心斑定义为具有致密核心、无沉积环带及较致密外缘的 Aβ 斑块。与其他沉积物相比,其密度相对较低。核心斑的真实数量可能被低估,因为根据切面位置不同,有时无法看到核心。既往研究报告的核心斑密度更高,在晚期 AD 中约占 Aβ 斑块的 20% [25],但本研究结果与 Delaère 等人 [20] 的神经突性老年斑计数基本一致。在 Tang 等人 [71] 人工标注的 Aβ 斑块集中,相对于占主导的弥漫斑,核心斑数量也较少,仅占标注图像的 2.2%,与我们的结果方向一致。此外,我们在分析中纳入了许多其他研究通常排除的小致密斑,进一步降低了核心斑的比例。本研究中,总体 Aβ 负荷较高的病例,其核心斑比例负荷反而降低,这对所提出的从弥漫斑到致密斑再到核心斑的简单线性演变提出了质疑。
值得关注的是,在晚期 AD 队列的大多数病例中,核心斑密度保持稳定,不受性别和 ApoE 基因型影响。文献中 ApoE4 对核心斑的影响并不一致 [7, 17, 59],而本研究采用晚期 AD 病例队列也会造成偏倚。死亡年龄较轻者及携带 PSEN1 突变的患者具有更高的核心斑密度。尽管并非每项研究均达到显著性 [90],文献中仍存在家族性及早发 AD 病例 Aβ 负荷较高、尤其是 Aβ42 较高的趋势 [29, 42, 51]。
有趣的是,核心斑是唯一与内嗅皮质 tau 负荷呈正相关的斑块类别。很大一部分核心斑同时也是神经突斑 [22, 25],后者与活化的小胶质细胞和反应性星形胶质细胞相关 [22]。尤其是伴神经突改变的核心斑、tau 以及突触和神经元丢失,与认知下降相关 [7, 23, 50, 64, 66]。总体而言,尽管核心斑密度相对较低,其临床相关性可能高于其他斑块类型。
淡染弥漫斑
淡染弥漫斑定义为大部分 Aβ 染色强度较低的斑块,是多数脑区中最大的斑块类别。它们在疾病早期出现 [56],主要由 Aβ42 组成,通常缺乏纤维 [37, 92]。本研究中,淡染弥漫斑与浓染弥漫斑和小致密斑呈低度正相关,与致密斑密度呈轻度负相关。一种假设性解释是,当淡染弥漫斑足够多时,持续的 Aβ 生成会使一些较大的淡染弥漫斑发展为浓染弥漫斑,一些较小的淡染弥漫斑则可能发展为小致密斑 [49, 82, 93],同时可能伴有从 Aβ42 向 Aβ40 的转变 [54, 55]。此外,小鼠实验提示存在不同机制,显示弥漫斑积聚并不必然增加致密斑负荷 [48]。因此,也可能是淡染弥漫斑消退,而更浓染和更致密的沉积物通过不同机制形成,而非一种形态直接转变为另一种。
淡染弥漫斑密度与内嗅皮质 tau 负荷呈负相关。这一发现与既往研究一致,后者显示弥漫性 Aβ 斑块与突触丢失或功能评分不相关 [50, 52],与神经突成分或小胶质细胞的关联较弱或不存在 [25, 36, 91]。
浓染弥漫斑
随着沉积物负荷增加,皮质区域中浓染弥漫斑的比例增加;本研究将其定义为具有致密、不规则中心和不清楚边缘的弥漫斑。浓染弥漫斑密度与致密斑及小致密斑呈正相关,与淡染弥漫斑呈弱相关。女性病例及 ApoE4 携带者的皮质浓染弥漫斑密度较高。
文献很少讨论已界定斑块类型之间的过渡型 Aβ 斑块,因此难以解释这些发现。然而,以往曾描述从细微弥漫斑到浓染弥漫斑的连续谱,以及部分弥漫斑较致密部位出现淀粉样纤维的现象 [49, 92]。我们的分析有两项突出结果:首先,随着 Aβ 斑块总负荷增加,只有浓染弥漫斑的比例份额表现出可辨识的增加。因此,可能是较高的 Aβ 斑块密度使弥漫斑形成更致密的核心,也可能是导致总体 Aβ 负荷升高的混杂因素同时促进浓染弥漫斑积聚。其次,在不同统计模型中,ApoE4 反复与较高的浓染弥漫斑密度相关,提示 ApoE4 有助于提高 Aβ 斑块的致密程度。这一结果与小鼠研究一致,后者显示 ApoE4 携带者的斑块形态更致密 [61]。ApoE4 增加 AD 风险和 Aβ 负荷的确切机制仍在讨论中,目前推测其增强聚集,并对 Aβ 清除产生不利影响 [46]。
致密斑
致密斑大多边界清楚,常呈卵圆形或圆形,包括棉絮斑和粗颗粒斑等亚型。我们未进一步区分这些亚类,以免各类别规模过小,从而进一步降低分类器性能。尽管称为致密,由于斑块内持续发生聚集与消退,多孔结构仍较常见 [18]。致密斑密度与浓染弥漫斑和小致密斑呈正相关,提示浓染弥漫斑、小致密斑和致密斑之间存在联系,并可能相互转变。另一方面,致密斑与淡染弥漫斑呈负相关,提示 AD 病例中的某些条件可能促成更多致密斑,例如 Hashimoto 等人 [33] 提出的 CLAC(胶原样阿尔茨海默病淀粉样斑块成分),或通过不同通路促成更多弥漫斑 [48]。
脑淀粉样血管病
Aβ 型脑淀粉样血管病(CAA)在此定义为软脑膜或脑实质内血管壁的 Aβ 沉积,主要累及小动脉,较少累及毛细血管。CAA 在额叶脑沟略为突出,在枕叶皮质尤其明显,与文献一致 [77, 79]。
我们既未发现 CAA 与皮质各区总体 Aβ 斑块负荷之间存在相关性,也未发现 CAA 与其他 Aβ 斑块类别之间存在相关性。因此,Kumar-Singh [41] 提出的 CAA 与致密 Aβ 沉积之间的统计学相关性,在我们的数据集中未获证实。女性和男性患者的 CAA 密度相近,因此我们也未能证实既往报告的男性病例 CAA 负荷较高的现象 [68]。这些不同结果可能归因于本研究标注的脑区相对较小,导致低密度沉积物并非总能得到足以表征其特征的呈现。在多重检验校正前,起病年龄较早及病程较短的 AD 病例具有更高的 CAA 密度,与既往发现一致 [76]。
既往文献将 ApoE4 描述为 CAA 的危险因素,而 ApoE2 与较大动脉中的 CAA 相关 [68, 73]。尽管本队列中不同 ApoE 状态未见显著差异,ApoE2 携带者相较 E3 纯合患者仍呈现 CAA 密度更高的非显著趋势。较高的 CAA 密度是否提示血管周围清除负荷过重 [8, 41],以及其是否独立关联于认知下降 [11],尚无法根据所得数据进一步验证。
小致密斑
小致密斑定义为体积较小(但大于 100 µm2)、大多致密的 Aβ 聚集。与浓染弥漫斑类似,文献并未明确定义此类别,但为涵盖病例中的变异性,本分析认为有必要设立该类。部分检测到的小致密斑可能对应核心斑的核心及燃尽斑 [41, 82],尽管小致密斑与核心斑之间并无正相关。另一部分可能对应细胞内沉积物的较大聚集 [19]。还有一些可能是非特异性、浓缩的细胞外沉积物,可能由先前较小的淡染弥漫性或浓染弥漫性沉积物形成,或将向浓染弥漫斑或致密斑发展。可以设想,其中一些沉积物正处于生长或消失过程中 [15, 70, 94],但其比例不明。
小致密斑密度与 Aβ 斑块总负荷,以及浓染弥漫斑和致密斑密度呈正相关,与淡染弥漫斑的正相关较弱,提示这些类别在形成过程中存在重叠。与既往观察一致 [65],无论从受累较轻至严重的脑区范围,还是从不同病程来看,均未见小致密斑向更大斑块(浓染弥漫斑或致密斑)发展的趋势。ApoE4 基因型与更多小致密斑相关,与讨论浓染弥漫斑时所述 E4 等位基因携带者具有更高凝聚程度的观察一致 [61]。
Aβ 沉积决定因素的整合
将性别、ApoE、起病年龄和病程整合至统计模型中,以预测皮质区域的斑块密度。我们发现,这些因素与各 Aβ 斑块类别之间的关系复杂、通常较弱,且部分依赖于脑区。较强的效应包括女性与较高淡染弥漫斑密度之间的正相关。此外,较年轻的临床起病年龄部分源于家族性 AD 病例,并与较高的核心斑及淡染弥漫斑密度相关。尽管 FDR 校正后未达到显著性,ApoE4 携带者仍存在浓染弥漫斑和小致密斑更多的趋势。
结果提示,危险因素及临床因素并非与所有形式的 Aβ 沉积物具有一致关联,而是与特定脑区的特定沉积物类别相关,例如 ApoE4 与较致密的沉积物相关,较年轻的起病年龄与核心斑相关。具体结果随统计模型中的共同因素而变化,提示效应通常较弱,且因素之间存在相互依赖。我们的简化模型未明确考察不同因素间的交互作用。然而,文献提示,年龄、性别和 ApoE 状态在不同组合下具有不同效应 [28, 84],并对病程产生混杂影响 [75]。在无痴呆人群中,这些因素还与可溶性和纤维性 Aβ 的不同比例相关,关联程度因脑区而异 [16]。
总体而言,这些关系似乎十分复杂,并造成不同个体脑内各异的组成。本研究通过提供按元数据区分的数据集,用于进一步相关分析(表 S18、S19),可为跨脑区影像及分子分析奠定基础。然而,斑块密度变异中仍有相当一部分无法由本研究考察的因素解释,提示生活方式因素和共病等其他决定因素也可能发挥作用。
局限性与进一步问题
本研究尝试在大型 AD 队列中跨脑区探究 Aβ 沉积的决定因素及相关因素。自动检测了大量 Aβ 沉积物,并将其分为六类。将观察结果与共病理、遗传及临床数据进行相关分析,提供了全面概述。
本项目的一项重要局限是数据集来源于西方国家的自愿脑捐献,因而存在偏倚。这导致族群多样性不足,且家族性 AD 病例比例过高。我们单独分析了 AD 相关突变对 Aβ 斑块组成的影响,以估计其作用。第二,受试者之间的脑区取样不均衡,可能对下游分析引入偏倚。完整数据子集的对照分析排除了较大的扭曲效应,但个别分析仍可能存在偏倚。第三,各脑区标注的矩形区域相对较小,存在不能代表整个脑区的风险。这尤其适用于低密度沉积物,即 CAA 及部分核心斑,或 Aβ 负荷较低的脑区。因此,本分析对 CAA 密度的表述持谨慎态度。第四,斑块分类器在许多实例中表现稳健,但部分情况下性能有限。形态范围广泛,且即使由人类判读也常难以明确分类,使过程进一步复杂化。此外,部分斑块的切面可能不具代表性,例如核心斑数量可能被低估,因为根据切面位置不同,有时无法看到核心。第五,本研究未反映 Aβ 寡聚体,小斑块(< 100 µm2)也在预处理时被去除。因此,下游分析缺少一些推测具有临床相关性的沉积物,需要后续研究加以阐明。第六,本研究仅涵盖与 Aβ 沉积直接或间接相关的部分因素。许多成分,如生活方式、教育程度、次要诊断和血管病理,以及临床表现的详细信息,均未纳入本分析。最后,由于本研究采用死后相关性研究方法,因果性结论仍属推测。
结论
通过对阿尔茨海默病病例组织学染色中的 Aβ 沉积物进行定量和分类,我们发现 Aβ 斑块以皮质分布为主,且很大程度上表现为未明确分化的弥漫性形态。仅核心斑与内嗅皮质 tau 负荷呈正相关。女性与较高的弥漫斑密度相关,ApoE4 基因型与较致密的斑块类型相关。较早的起病年龄和死亡年龄与较高的淡染弥漫斑密度相关。效应大小取决于脑区及决定因素的共同作用。与弥漫斑、小斑块和致密斑相比,核心斑和 CAA 尽管密度相对较低,却在统计学上表现突出,提示它们在阿尔茨海默病进程中具有特殊作用。
- 84 advanced AD cases, up to 23 brain regions, 4G8 DAB stains: deposits segmented by a random forest pixel classifier and classified by a CNN into six classes (cored, diffuse light, diffuse dense, compact, small dense plaques, CAA); test-set recall 81.5%, precision 82.4%.
- Cortical regions carried the highest Aβ plaque loads, mainly diffuse light and small dense plaques; plaque densities correlated within and across hippocampal and cortical regions.
- Diffuse dense, small dense and compact plaques correlated positively with one another; cored plaques and CAA did not correlate with other classes, and only cored plaques correlated positively with entorhinal tau load.
- Female sex was associated with more diffuse plaques and ApoE4 with diffuse dense/small dense plaques; earlier age at onset and death with higher densities of diffuse light plaques.
Scope: open-access full text (CC BY 4.0) from Acta Neuropathologica — abstract, introduction, materials and methods, results, discussion and conclusion, with 8 figures and 3 tables (with notes); references, supplementary material, author information and declarations are not included. Bracketed numbers are the original reference numbers.
Abstract
Amyloid beta (Aβ) deposition and tau accumulation are neuropathological hallmarks of Alzheimer’s disease (AD). While Aβ deposits present with a wide morphological variety, a comprehensive, cross-regional overview of Aβ plaque composition in AD and associations with clinicopathological traits are missing. In this study, we systematically documented the abundance and morphological diversity of Aβ plaques in up to 23 brain regions of 84 advanced AD cases. Deposits were segmented with a random forest pixel classifier in 4G8 diaminobenzidine stains and classified into six classes using a convolutional neural network (cored, diffuse light, diffuse dense, compact, small dense plaques, cerebral amyloid angiopathy (CAA)). Deposit counts were correlated between classes, regions, and tau load using Pearson correlation. Associations between plaque densities and co-pathologies, sex, ApoE, familial vs. sporadic cases, age at clinical onset, disease duration, and age at death were examined. Our classification model achieved a recall of 81.5% and a precision of 82.4% in the test set. Cortical brain regions showed the highest Aβ plaque loads, predominantly consisting of diffuse light and small dense plaques. Plaque densities correlated within and across the hippocampal and cortical regions. Abundances of diffuse dense, small dense, and compact plaques were positively correlated with one another, while densities of cored plaques and CAA did not correlate with other plaque classes. Only cored plaques were positively correlated with the entorhinal tau load, while other plaque classes, except CAA, showed negative correlations. Notably, female sex was associated with more diffuse plaques, and ApoE4 was associated with diffuse dense and small dense plaques. Earlier age at onset and death were associated with higher densities of diffuse light plaques. Overall, associations varied across brain regions and plaque classes. Cored plaques and CAA stand out statistically from other Aβ deposits, suggesting distinct association patterns in the course of the disease.
Introduction
Amyloid beta (Aβ) plaques, alongside hyperphosphorylated tau deposition, are the neuropathological hallmarks of Alzheimer’s disease (AD) [12, 44, 82], the most common form of dementia [43, 44]. Aβ, a cleavage product of the amyloid precursor protein (APP), accumulates mostly in the extracellular space in the brain and spreads via misfolding and seeded protein aggregation [38, 53, 82]. The aggregation usually begins in the associative cortices and appears in subcortical areas, the brainstem, and the cerebellum at later stages, according to Thal phases 1 to 5 [73]. Thereby, Aβ is seen as an initiator of the AD-related pathology, preceding tau pathology, synapse and neuron loss, and cognitive decline [5, 32, 82]. This view is strongly supported by the fact that familial cases of Alzheimer’s disease involving an APP or PSEN1/2 mutation exhibit altered Aβ metabolism [82]. Although the general Aβ load does not exclusively account for all ongoing processes in dementia [21], numerous therapeutic approaches are directed against Aβ deposition with varying degrees of success [5, 30, 95].
A complicating factor is that Aβ deposition is highly heterogeneous [40, 72, 82, 85]. The deposits range from frequently described diffuse plaques, classical cored plaques, cerebral amyloid angiopathy (CAA) [72, 82] and distinct plaque types, such as cotton-wool plaques [35, 45] and coarse-grained plaques [9, 10]. Further deposits without explicit names were observed as subpial bands, stellate-shaped deposits, small puncta, and intracellular inclusions [82]. Besides plaques, Aβ also appears in toxic, small oligomeric species, which may partly be derived from larger deposits or generated intracellularly [31, 78, 83].
Diverse morphologies can reflect local tissue structure, altered molecular compositions, and are associated with varying determinants and reactions [27, 40, 72, 82]. The AD risk factor ApoE4 for example, is associated with generally higher cortical Aβ loads [58, 63], including higher loads of Aβ oligomers [34]. Female sex was also related to higher Aβ loads [1, 57, 58], although not in every study [6]. While diffuse Aβ plaques commonly occur in aging without cognitive impairment [20, 24], cored plaques were associated with cognitive decline [47, 50]. Especially neuritic cored plaques are known for an accompanying immune reaction with microglia infiltration [67]. Moreover, it has been suggested that some plaques undergo a progression from diffuse deposits to more fibrillar and compact to classic cored plaques, and finally to ‘burned-out’ plaques lacking a diffuse ring [62, 72, 82], while other studies suggest distinct factors influencing the plaque morphology [33, 48].
While many papers discuss individual components of specific Aβ plaques in a few brain regions, a comprehensive overview, quantifying and classifying Aβ plaques across brain regions in a large human AD cohort, is missing. For a large-scale approach, automated analysis is necessary. In recent years, several algorithms for Aβ plaque segmentation [58, 81] and classification were developed, achieving high accuracies [3, 40, 60, 71, 80, 89]. However, current light microscopy plaque classifiers are often limited to a subset of classes, which is not representative of broader, real compositions [71, 89].
In this study, Aβ deposits from up to 23 brain regions of a large cohort of 84 advanced familial and sporadic AD cases were extracted from immunohistochemical Aβ stains. Building upon the convolutional neural network by Tang et al. [71], we trained a more class-comprehensive algorithm: plaques were classified into six classes, namely cored, diffuse light, diffuse dense, compact, small dense plaques, and CAA. Absolute plaque densities and relative class loads were mapped across the brain, checked for correlations, and examined for associations with tau, alpha-Synuclein (α-syn) and TDP43 co-pathology. Furthermore, associations with sex, ApoE genotype, familial AD mutations, age at clinical disease onset, disease duration, and age at death were investigated. Finally, a cross-factor statistical model was developed to integrate various dimensions to identify Aβ deposit class-specific determining factors.
Materials and methods
Human cohort and neuropathological assessment
Human brain samples were acquired from the Neurobiobank Munich, which collects brains in accordance with the Code of Conduct of Brain-Net Europe [39] and in agreement with the local ethics committee. Brains were collected from voluntary donors after informed consent by the donor when alive or closest relatives conforming with the presumed will of the donor. This study follows the principles of the Declaration of Helsinki and is in accordance with the local ethics committee. At least two board-certified neuropathologists conducted the neuropathological assessments.
Inclusion criteria for this study were 1) registration of the case in the digital brain bank form as advanced, neuropathologically defined AD (Braak and Braak stage IV, V, or VI) and 2) availability of scanned diaminobenzidine (DAB) Aβ stains. Cases with other suspected clinical diagnoses, but AD-related changes in the neuropathological examination and cases with co-pathologies were also included. These criteria resulted in a cohort of 84 AD cases (Table 1, Fig. S1).
| Available n (% of the cohort) | Cohort (absolute) | Cohort (%) | |
|---|---|---|---|
| n (%) | 84 (100%) | 84 | 100% |
| Clinical diagnosis (AD: FTD: PD)a | 84 (100%) | 51: 7: 6 | 61%: 8%: 7% |
| Sex (female: male) | 84 (100%) | 46: 38 | 55%: 45% |
| Age at onset [years] | 70 (83%) | 61.6 ± 12.2 | |
| Disease duration [years] | 70 (83%) | 10.9 ± 5.9 | |
| Age at death [years] | 83 (99%) | 73.9 ± 11.4 | |
| Braak and Braak (IV: V: VI) | 84 (100%) | 10: 15: 59 | 12%: 18%: 70% |
| Thal phase (3: 4: 5) | 79 (94%)b | 2: 10: 67 | 3%: 13%: 85% |
| CERAD (B: C) | 73 (87%) | 6: 67 | 8%: 92% |
| ApoE ((E2/E3): (E2/E4): (E3/E3): (E3/E4): (E4/E4)) | 78 (93%) | 4: 1: 28: 38: 7 | 5%: 1%: 36%: 49%: 9% |
| WGS (no mutation: APP: PSEN1: PSEN2: TREM2) | 70 (83%) | 50: 3: 13c: 3: 1 | 71%: 4%: 19%: 4%: 1% |
| α-syn (neg: amygdala: brainstem: cortical) | 71 (85%) | 29: 15: 5: 22 | 41%: 21%: 7%: 31% |
| TDP43 (neg: pos)d | 60 (71%) | 32: 28 | 53%: 47% |
AD Alzheimer’s disease; PD Parkinson’s disease; FTD Frontotemporal dementia; WGS whole genome sequencing aFor clarity, only the most common clinical diagnoses are listed here. The complete diagnoses list for the cohort can be found in Fig. S1a bRegarding the five missing cases, four have a Thal phase ≥3 and one case ≥2 cIn one patient both, a PSEN1 and a TREM2 mutation, were found. Only the PSEN1 mutation is listed here dBinary values of the TDP43 status, based on the assessment of amygdala, hippocampus and medulla oblongata where available, were extracted from the biobank database
Formalin-fixed and paraffin-embedded tissue was manually sliced into 5 µm thick slices. Further processing was conducted in a Ventana Bench-Mark Ultra system (Roche). Slices were pretreated with 80% formic acid for 15 min and Cell Conditioning (CC1) Tris-based buffer (Roche). The monoclonal antibody, clone 4G8 (BioLegend, #800,701; dilution 1:5000), was applied as primary antibody for Aβ staining with a Ventana antibody dilution buffer (Roche, #251–018). Detection was conducted with an ultraView Universal DAB Detection Kit (#760–500, Roche), and hematoxylin and bluing reagent (Roche) was used for nuclear counterstain. Details about the staining for phosphorylated tau with the monoclonal antibody AT8 (ThermoFisher, #MN1020; dilution 1:400) and for α-syn with a monoclonal antibody (clone 42; BDTransduction, #610,787; dilution 1:1000) staining were described elsewhere before [58].
Depending on the availability of Aβ stains across AD cases of the Neurobiobank Munich, up to 23 brain regions per case were included for further analysis (Fig. 1, Fig. S2). The regions comprise eleven cortical regions, five subcortical regions, CA1-4 and subiculum as hippocampal subregions, and the cerebellar cortex as well as the dentate nucleus of the cerebellum.
The ApoE genotype and AD-related mutations were extracted from whole genome sequencing data, described elsewhere before [58, 69]. In short, DNA was isolated from fresh frozen cerebellar tissue with the QIAmp DNA Mini Kit (Qiagen, 51,304). The TruSeq PCR-free genomic DNA library prep kit (Illumina, FC-121-3003) was used for library preparation. Sequencing of 2×150 bp paired-end libraries was conducted on an Illumina NovaSeq machine to a depth of at least 35X. A Snakemake pipeline incorporating the GATK best practices was used for alignment and variant calling. Quality control was done with FastQC. After adapter trimming, BWA-MEM2 was used for alignment to the hs1/T2T genome assembly (chm13v2.0). Variant calling, recalibration, and joint genotyping were performed with GATK (version 4.0). The ApoE specific variants (rsID/hs1 coordinates: rs429358/chr19:47,733,380; rs7412/chr19:47,733,518) were gathered to determine the ApoE genotype.
Image analysis and deposit detection
Image acquisition and initial deposit detection were conducted as previously described [58]. In short, Aβ stains were digitized using a Zeiss Axio Scan Z.1 scanner with a 20× magnification. Following a standardized protocol (Table S1) [58], gray matter regions were annotated manually in QuPath (version 0.5.1) [4] in α-synuclein stains of the same samples where available and were registered onto Aβ and tau stains with non-rigid co-registration by DeeperHistreg in Python (Python version 3.10.12) [58, 86,87,88]. Cortical regions were annotated with rectangles spanning from the white matter to the cortex surface to consistently cover all layers. Annotations were corrected if necessary to avoid artifacts or large blood vessels. Standardized sizes for cortical regions, around 1 mm2, and non-cortical regions, around 0.7 mm2, were aimed for. In the implementation, the annotation sizes vary to a limited degree due to anatomical conditions, such as small regions of interest and the precise plane of sectioning during autopsy (see Table S1 for details).
For further computations, the annotated regions were partitioned into tiles of 4096*4096 pixels (900*900 µm2). As part of the preprocessing, Aβ and tau tiles underwent color-deconvolution to extract the brown DAB signal and conversion to grayscale. A random forest pixel classifier, trained in ilastik (version 1.4.0) for Aβ deposit detection and a second pixel classifier for tau detection [58], were applied to these grayscale images, resulting in probability maps. Deposit segmentations were extracted by thresholding the probability maps with 0.7 for both Aβ and tau. Subsequently, Aβ and tau covered area were calculated as the ratio of the segmented area divided by the whole area of the annotated region of interest.
To extract individual Aβ deposits, the deposit segmentation mask was passed through a smoothing step to capture specifically cored and diffuse plaques in one piece each. E.g., the dense core and the more diffuse surrounding Aβ positivity of a cored plaque should be detected as a single, continuous plaque instead of two separate components. As this step leads to a conflation of moderately defined, diffuse plaques, a watershed step was added for disproportionately large deposits (> 80,000 pixels, which equals 3865 µm2). Small deposits were removed by a size threshold of (< 2070 pixels, which equals 100 µm2) because they mostly cannot be meaningfully differentiated, and to reduce the computational workload. Deposits that were located outside of the annotated area of interest with more than 50% of their deposit area were excluded as external deposits. The thus defined object masks (Fig. 1c) were applied to the underlying grayscale or color image to extract 512*512-pixel squares (Fig. 2a), centered on the object mask. Deposits were captured from grayscale images for machine learning-based classification and from raw color images for manual annotation. If deposits were larger, they were scaled down to fit the standardized square size. Adjacent deposits that were accidentally depicted on the squares, although they did not correspond to the target deposit, were removed from the grayscale images.
Aβ deposit classification
While former models, including the model by Tang et al. [71], concentrated on three classes, namely cored, diffuse and CAA, we aimed to distinguish more classes: a) to capture and describe a wider range and heterogeneity of plaques and b) to be able to meaningfully classify all detected deposits. The classes were defined based on descriptions in the literature and morphologically reproducible distinguishability. Preliminary attempts to manually classify the deposits eventually led to a distinction between cored plaques, diffuse light plaques, diffuse dense plaques, compact plaques, CAA, and small dense plaques. Descriptions are listed in Table 2. Deposits for training the classifier were extracted from a selection of whole image tiles of the study cohort that contained region annotations in at least parts of the tile. These tiles were visually chosen to cover a wide range of morphologies. Particular attention was paid to ensuring a diversity of cored plaques and CAA, which would otherwise be even more underrepresented in terms of numbers. Eventually, the training set was partially overlapping, but not completely a subset of the later evaluated deposits. In total, 3139 deposits from training images of 52 patients across regions were manually classified by one rater (AN) with visual confirmation by board-certified neuropathologists. While the manual classification by one primary rater introduced a bias in the classifier, this bias remained consistent across the deposit evaluation and later correction. In spite of preliminary plaque definitions and accompanying reference images, an unambiguous classification of many deposits is not possible; consistency despite subjective categorization is a realistic approximation to this subtle task. 15% of the deposits from every class were randomly assigned to the test set, while the remaining 85% were assigned to the training set. From the latter, 20% were randomly chosen for validation during hyperparameter optimization (Table 3).
| Class | Description |
|---|---|
| Cored | Classic plaque with dense core, free or poor ring, and denser, often diffuse rim |
| Diffuse light | Diffuse plaque with mostly low intensity and without dense centers; often with indistinct edges; also includes many pial and subpial deposits |
| Diffuse dense | Diffuse plaque with dense, irregular centers, and indistinct edges |
| Compact | Compact plaque with comparably homogeneous intensity and mostly sharp border; includes cotton wool and coarse-grained plaques |
| CAA | Cerebral amyloid angiopathy: often circular Aβ deposits in blood vessel walls or parts of blood vessel walls |
| Small dense | Small, mostly dense and often round deposit, partly intracellular Aβ deposit |
CAA cerebral amyloid angiopathy
| Class | n (all) | n (train) | n (validation) | n (test) | Recall (test) | Precision (test) |
|---|---|---|---|---|---|---|
| Cored | 161 | 108 | 29 | 24 | 62.5% | 46.9% |
| Diffuse light | 999 | 688 | 161 | 150 | 88.0% | 88.6% |
| Diffuse dense | 424 | 291 | 69 | 64 | 71.9% | 67.6% |
| Compact | 430 | 290 | 76 | 64 | 67.2% | 78.2% |
| CAA | 412 | 280 | 70 | 62 | 85.5% | 80.3% |
| Small dense | 713 | 478 | 128 | 107 | 88.8% | 94.1% |
| Total | 3139 | 2135 | 533 | 471 | 81.5% | 82.4% |
Recall (true positives / (true positives + false negatives)); precision (true positives / (true positives + false positives)); CAA cerebral amyloid angiopathy While classes were balanced with additional data augmentation for training, the test set remained imbalanced, representing more realistic distributions. For the actual model application, apparent false-positive predictions for the classes ‘cored plaques’ and ‘CAA’ were corrected by visual adjudication, while false negatives assigned to other classes could not be systematically recovered
In relation to the underrepresentation of each class, the training images of the classes were expanded by data augmentation, including rotation, flipping, color jitter, shifting, shearing and scaling, resulting in a class-balanced training.
Appropriate to the task of morphological classification of images, a convolutional neural network (CNN) was created, based on the model architecture of the high-performance Aβ plaque classification from Tang et al. [71]. Due to the increased number of classes, a convolutional layer was added to the architecture implemented by Tang et al. [71] to represent the higher complexity. Additionally, the parameters were adapted to the input size of 512*512 pixels. The resulting structure includes seven blocks of 2D convolutional layers with 3×3 kernels and accompanying max-pooling for size reduction (Fig. 2). Model parameters were optimized by a cross-entropy loss.
The CNNs were further optimized regarding batch size, number of epochs, learning rate, severity of data augmentation, and distinction of diffuse plaques (Fig. S3). Experiments revealed comparable performance with batch sizes of 18 and 24, stabilization of parameters until epoch 60, and best performance with a learning rate of 0.0001 and moderate data augmentation. Moderate data augmentation with torchvision (version 0.18.1) included random rotation, horizontal and vertical flip, color jitter (transforms.ColorJitter(brightness=0.1, contrast=0.1, saturation=0.1, hue=0.02)), and further low-grade geometric augmentations (transforms.RandomAffine(0, translate=(0.05, 0.05), scale=(0.95, 1.05), shear=10)). Additionally, the distinction of two classes for diffuse plaques, namely lighter and denser diffuse plaques, did not lead to deterioration, but rather to an equal or improved overall performance. After preselection of three candidate models with the validation set, a final model was chosen with the highest performance in the holdout test set (Table 3). This model was trained with a batch size of 24 for 56 epochs with moderate data augmentation, optimal learning rate, and distinction of six classes.
Code and models, including the ilastik random forest pixel classifier and the convolutional neural network parameters for deposit classification, are publicly available on GitHub (https://github.com/cor2ni/Abeta_histo_classifier).
Statistical analysis
Brain regions were compared regarding absolute deposit loads and deposit class proportions, applying Kruskal–Wallis tests and Dunn’s post hoc analyses with FDR Benjamini–Hochberg correction for multiple testing. To evaluate the effect of uneven area sampling between subjects, i.e., not every brain region was available for Aβ staining in every subject, we introduced a variable called complete subset, for 40 subjects which completed staining in nine selected brain regions (frontal, occipital, hippocampal and cerebellum regions). The Kruskal–Wallis tests and Dunn’s post hoc analysis with FDR correction were repeated in this complete subset. Additionally, Wilcoxon signed-rank tests with FDR correction were applied in the complete subset to account for paired measurements by patient IDs. Furthermore, we applied multiple linear regression models for each of these nine brain regions separately: total plaque counts, absolute and relative class-wise plaque counts were dependent variables; complete subset was the independent variable; and age at death, sex and ApoE genotype were covariates. This allowed us to assess whether this complete subset behaves differently from the overall cohort.
To examine correlations between deposit classes across cortical regions, the absolute and percental load of each class was correlated with the overall load of Aβ deposits in the same region by Pearson correlation with subsequent FDR correction, after accounting for inherent region differences by linear regression. As a control analysis to correct for within-patient dependence, patient ID was added next to the region in the linear regression model. The whole approach was repeated to correlate absolute and percental loads of each class with the absolute and percental loads of the other classes. Respective results were visualized as heatmaps. As an exemplary, region-specific visualization, absolute and relative Aβ deposit classes of the middle frontal gyrus were correlated with each other using Pearson correlation and visualized as scatter plots. The approach was repeated for correlating Aβ classes across cortical regions with the entorhinal tau covered area, presented as a heatmap, and for correlating Aβ classes in the middle frontal gyrus with the entorhinal tau covered area, presented as scatter plots.
To investigate the associations between Aβ deposit classes and putatively predicting or affected variables, multiple linear regression models were applied across cortical regions. In detail, the absolute (or relative) deposit class loads were the dependent variable. The independent variables of interest were Braak and Braak stage as a measurement for tau (additional correction for age at death, sex and ApoE genotype), α-syn co-pathology (additional correction for age at death, sex and ApoE genotype), TDP43 co-pathology (additional correction for age at death, sex and ApoE genotype), sex (additional correction for age at death and ApoE genotype), ApoE genotype (additional correction for age at death and sex), genetic AD (additional correction for sex and ApoE genotype), age at clinical disease onset (additional correction for sex and ApoE genotype), disease duration (additional correction for age at death, sex and ApoE genotype) and age at death (additional correction for sex and ApoE genotype). Additionally, all models included the region name as a categorical covariate to correct for brain region differences. P-values were adjusted with FDR Benjamini–Hochberg correction for multiple testing of each independent variable comparison, respectively. As control analyses for within-patient dependence, these regression models were repeated as linear mixed-effects models with a random effect for patient ID. However, with subsequent FDR correction, there remained no significant results, suggesting an overcorrection. For this reason, and to avoid making the paper more difficult to read, only the results of the linear regression models are reported below.
To integrate several factors into a single analysis, linear mixed-effects models were created with deposits/mm2 of each class as the dependent variable; brain region, sex, ApoE4 status, age at onset, and disease duration as independent variables; and patient ID as a random effect:
Deposit class x ~ C(region) + C(sex) + C(ApoE4) + age at onset + disease duration + (1 | patient ID).
Categorical variables are indicated with a C(). P-values were adjusted with the FDR Benjamini–Hochberg correction for multiple testing across all linear mixed-effects models. Furthermore, multiple linear regression models were created for several exemplary regions with the class-wise deposit density as the dependent variable, and sex, ApoE4 status, age at onset and disease duration as independent variables. The significance level was set to p < 0.05 (*), p < 0.01 (**), and p < 0.001 (***) for all analyses. Plots and statistics were implemented with Python (version 3.10.12).
Results
We disentangled the commonalities and heterogeneity of Aβ pathology across Alzheimer’s disease (AD) cases by automatically quantifying and classifying Aβ deposits across 84 humans, including up to 23 brain regions per case. In total, 57,233 Aβ deposits were extracted from immunohistochemical stains of 1179 annotated regions and assigned to six deposit classes (cored, diffuse light, diffuse dense, compact, CAA, small dense) using a convolutional neural network (CNN).
Readers should interpret the results with consideration of the dataset, which contains a recruitment bias based on voluntary brain donation (Table 1). Due to 29% of familial AD cases, the cohort has an average age at clinical disease onset of 61.6 ± 12.2 years and an average age at death of 73.9 ± 11.4 years. 55% of the cohort are female. All cases clinically presented with dementia. Most cases showed high Braak and Braak stages (V or VI) and a Thal phase 5. To provide reasonable templates for correlation analyses in future studies without disclosing individual data due to data protection, Table S19 supplies region and sub-cohort specific Aβ deposit counts per mm2. The respective column names are explained in Table S18.
Aβ deposit classifier performance
The distinction of Aβ deposits into six classes (Fig. 2) is a compromise between a large number of distinguishable classes and a sufficiently high frequency for each class. While cored plaques and CAA are commonly known, diffuse plaques were further subdivided into diffuse light and diffuse dense plaques. Compact plaques were merged with rarer coarse-grained and cotton-wool plaques. Small dense plaques cover the remaining deposits. The respective contextualization within the literature is addressed in the discussion. The smallest (< 100 µm2) Aβ objects were excluded to keep the computational effort reasonable. For standardized, large-scale, quantitative classification of Aβ deposits, a convolutional neural network was trained and optimized (Fig. S3) to assign input images to six classes. The model was trained on 2135 images, validated on 533 images, and tested on a held-out test set of 471 manually classified images.
In the test set, the model achieved a high recall of 81.5% (true positives / (true positives + false negatives)) and a high precision of 82.4% (true positives / (true positives + false positives)) (Table 3). The recall was greater than 85% in three deposit classes, namely diffuse light, CAA, and small dense plaques. Diffuse dense and compact plaques were classified most of the time correctly with a recall of 71.9% and 67.2%. Cored plaques achieved the lowest recall with 62.5%, with most incorrect calls being classified as diffuse dense deposits. The precision was the highest regarding small dense deposits (94.1%) and diffuse light deposits (88.6%), which also represent the most common deposits. The model precision was medium high for CAA (80.3%), compact (78.2%), and diffuse dense plaques (67.6%). Cored plaques were detected with a relatively low precision of 46.9% in the test set. To improve the low precision in cored plaques and CAA, the two smallest classes, all deposits that were classified as cored plaques or CAA were visually checked and reclassified by one rater (AN) as needed. This included 2955 deposits labeled as cored plaques, of which 68.7% were manually reassigned to other classes, and 2276 deposits labeled as CAA, of which 82.7% were reassigned to other classes (Fig. S4). The difference in precision compared to the test set is likely due to the smaller proportion of cored plaques and CAA in the application dataset compared to the test set and a fraction of deposits with a morphology that is difficult to classify. These results underscore the importance of manual verification of predictions as cored plaques and CAA from our model, while the other classes were significantly larger in number and thereby more robust in the large-scale application. Furthermore, the fact that cored plaques can only be reliably identified if the core is in the sectional plane, is a limitation of the two-dimensional approach which leads to a general underestimation of this plaque type. The precision between subsets of classes likely also reflects ambiguity of morphologies. Overall, the model demonstrates solid and realistic classifications across a large dataset with some manual assistance. The advantages of the presented convolutional neural network lie in the distinction between six classes and in the fact that all detected deposits can be categorized into these classes.
Regional differences in Aβ deposition
While most cortical regions showed comparably high deposit counts (median between 81/mm2 in the insula cortex to 104/mm2 in the frontal sulcus), the occipital gyrus and sulcus, parahippocampal, and entorhinal cortex showed significantly lower deposit counts (median range 28/mm2 in the entorhinal cortex to 50/mm2 in the occipital sulcus) (Fig. 3a, S6, Table S2). Comparing the regions with a Kruskal–Wallis test and Dunn’s post hoc analysis with FDR correction for multiple testing (Table S4), the cortical regions predominantly showed significantly higher total Aβ deposit counts than the subcortical, hippocampal, and cerebellar regions (median range 0/mm2 in the dentate nucleus of the cerebellum to 49/mm2 in the putamen). The overall distribution persisted when comparing a subset of 40 cases with nine complete sampling areas with a Kruskal–Wallis test and Dunn’s post hoc analysis or Wilcoxon signed-rank test and subsequent FDR correction (Fig. S5, Table S11), limiting a potential sampling bias. Additionally, total and class-wise plaque densities between the complete subset (38 cases due to missing metadata in two cases) and the whole cohort were compared with multiple linear regression, correcting for age at death, sex and ApoE in the same nine brain regions. There was no significant difference after FDR correction, supporting the representativeness of the cohort. These results suggest the highest Aβ deposition in cortical regions with relatively homogeneous loads, with lower values only in the occipital or entorhinal regions. Subcortical, hippocampal, and cerebellar regions were less affected, suggesting fewer stressors, mechanisms sparing these regions, or more protective factors for Aβ deposition in these areas.
In a second step, the proportional load of each deposit class in relation to the total count of Aβ deposits in a specific region was compared between regions (Fig. 3b, Table S3). Diffuse light plaques predominated in most of the regions (median range from 12% in the CA3 region of the hippocampus to 78% in the medial nucleus of the thalamus). Small dense plaques ranked second and diffuse dense plaques ranked third in most of the regions. Compact plaques followed in fourth place. In general, the proportions of cored plaques and CAA played a subordinate role across regions with median percentages around 0%. These results suggest that a large proportion of the plaques correspond to poorly differentiated diffuse and often small deposits. In comparison, relatively few deposits belong to specific groups, such as CAA, compact or cored plaques. Across brain regions, cortical regions tended to have higher proportions of cored and compact plaques compared to non-cortical brain regions (Table S5, S8). Diffuse light plaques were especially dominant in the parahippocampal and entorhinal cortex and in the medial thalamic nucleus, while their proportion was relatively low in the CA3 and CA4 region of the hippocampus (Table S6). Frontal and occipital sulcal cortex showed increased proportions of CAA (Table S9). The entorhinal cortex presented with a relatively low proportion of small dense plaques (Table S10). The results largely agreed with the outcomes of a complete data subset in nine brain regions with predominantly similar results for the Kruskal–Wallis test with Dunn’s post hoc analysis and the Wilcoxon signed-rank test (Table S12–17). Comparing proportional deposit densities between the whole cohort and a complete subset (consisting of 14 cases due to incomplete metadata or no detected deposits in one or more of the nine brain regions) using multiple linear regression, there were no significant differences before or after FDR correction, also limiting a potential bias from sampling.
To evaluate if Aβ loads are correlated between brain regions, a Pearson correlation analysis was applied between the total plaque counts of 23 regions with subsequent FDR correction for multiple testing (Fig. 3c, S7, S8). Aβ deposit counts of all cortical regions were positively correlated except for the entorhinal cortex, partly due to fewer available stains in this region (Fig. S8). High positive correlations were also observed within the hippocampal regions and between the hippocampal and cortical regions. There were no significant negative correlations observed between Aβ loads of brain regions. Correlating the Aβ loads of specific deposit classes between brain regions (Fig. 3c, S9), the three positively associated region groups, namely cortical regions, hippocampal regions, and their combination, were also apparent for diffuse light, diffuse dense, and small dense plaques. There were rare significant positive correlations between brain regions regarding the densities of CAA, compact, or cored plaques.
Correlations between Aβ deposits
Next, the counts of individual deposit classes per region were correlated with the absolute counts of all deposits in the same region by Pearson correlation. This was done across cortical regions, after correcting for the region names by regression, and with subsequent FDR correction (Fig. 4a, S12), and for the middle frontal gyrus (MFG) separately for visualization purposes (Fig. 4b). Across cortical regions and in the middle frontal gyrus, there was a high positive correlation between the total absolute plaque count and the absolute counts of diffuse light (across cortex: r=0.76, p<0.001; MFG: r=0.74, p<0.01) and small dense plaques (across cortex: r=0.75, p<0.001; MFG: r=0.84, p<0.01), a moderate correlation with diffuse dense plaques (across cortex: r=0.69, p<0.001; MFG: r=0.8, p<0.01) and a low correlation with compact plaques (across cortex: r=0.41, p<0.001; MFG: r=0.55, p<0.01). In contrast, the densities of cored plaques and CAA did not correlate with the total Aβ plaque load. The latter results suggest a special role for cored plaques and CAA as not simply linearly accumulating.
To examine whether cases with higher total deposit counts show different class compositions, the above analyses were repeated with relative instead of absolute plaque counts (Fig. 4c and d). While the proportions of diffuse dense (across cortex: r=0.23, p<0.001; MFG: r=0.4, p<0.01) and small dense plaques (across cortex: r=0.088, p=0.043) increased weakly across cortical regions with increasing total plaque counts, the proportions of cored (across cortex: r=− 0.29, p<0.001; MFG: r=−0.31, p=0.01) and compact plaques (across cortex: r=−0.16, p<0.001), as well as CAA (across cortex: r=−0.15, p=0.001), were weakly negatively correlated. Keeping in mind that all included cases show advanced AD-related pathology and dementia, these findings indicate that diffuse dense plaques can broadly accumulate before death, while densities of cored plaques, compact plaques, and CAA do not increase to the same extent.
As an alternative measure for overall deposit loads, we correlated absolute and proportional loads of each deposit class with the Aβ covered area in the same cortical region (Fig. S14). The results largely correspond to the findings described above with deposit counts/mm2. A particularly strong correlation between diffuse dense plaques and Aβ covered area is noteworthy (across cortex: r=0.78, p<0.001; MFG: r=0.86, p<0.01), suggesting that particularly the number of diffuse dense plaques increases in severely Aβ-affected AD cases.
Furthermore, correlations between deposit class densities across cortical regions were examined with Pearson correlation and FDR correction, after adjusting for individual regions through linear regression. The overall heatmap and exemplary scatter plots from the MFG are shown in Fig. 4e and f. Of particular note are moderate to high positive correlations between diffuse dense and small dense plaques (across cortex: r=0.79, p<0.001; MFG: r=0.89, p<0.01), and diffuse dense and compact plaques (across cortex: r=0.66, p<0.001; MFG: r=0.71, p<0.01), suggesting that they not only show overlaps in terms of image morphology, but may also arise under the same conditions. Diffuse light plaques present minor positive correlations with small dense (across cortex: r=0.22, p<0.001) and diffuse dense plaques (across cortex: r=0.12, p=0.012). A weak negative correlation was observed between diffuse light and compact plaques (across cortex: r=−0.1, p=0.037), suggesting that cases tend to lean towards one or the other direction.
To investigate the associations between deposit classes, corrected for the total deposit counts, the correlation analysis was repeated with relative plaque counts (Fig. 4g and h). As before, there was a positive, but weaker correlation between diffuse dense and compact plaques (across cortex: r=0.47, p<0.001; MFG: r=0.48, p<0.01) and diffuse dense and small dense plaques (across cortex: r=0.27, p<0.001). This analysis further highlights a negative correlation between diffuse light plaques and diffuse dense (across cortex: r=− 0.76, p<0.001; MFG: r=−0.79, p<0.01), compact (across cortex: r=− 0.68, p<0.001; MFG: r=− 0.67, p<0.01), small dense plaques (across cortex: r=−0.68, p<0.001; MFG: r=−0.8, p<0.01), and CAA (across cortex: r=−0.2, p<0.001). These findings suggest separate mechanisms that lead to either diffuse light Aβ deposition in the cortex or formation of denser and more compact deposits, however, independently of cored plaques. When patient ID was included in the above analyses by linear regression, the Pearson correlation coefficients appeared slightly lower; however, overall, the results remained comparable (Fig. S13).
Associations between Aβ deposits, tau and co-pathologies
To examine whether specific Aβ plaques are correlated with the extent of an overall tau load measurement, the associations between absolute counts/mm2 of each Aβ deposit class with the tau-covered area in percent in the entorhinal cortex were examined across cortical regions (Fig. 5a, Fig. S15). After adjusting the Aβ values for individual regions using linear regression, the Aβ class counts and tau area ratio were examined for correlation using Pearson correlation and FDR correction. Only cored plaques showed a significant positive correlation with entorhinal tau (r=0.11, p=0.034). The entorhinal tau load was significantly negatively correlated with diffuse light (r=−0.15, p=0.006), diffuse dense (r=−0.23, p<0.001), compact (r=−0.14, p=0.01), and small dense plaques (r=−0.17, p=0.002) across cortical regions. No correlation between CAA/mm2 and the tau-covered area in the entorhinal cortex was observed. Additionally correcting for patient ID with linear regression led to no significant results (Fig. S13). Correlating percental loads of Aβ plaques across cortical regions with the entorhinal tau load, there was a significant positive correlation with cored plaques (r=0.14, p=0.027) and a significant negative correlation with diffuse dense plaques (r=− 0.12, p=0.049). In total, these results suggest that cored plaques are more likely to be associated with a higher entorhinal tau load, while other plaque classes accumulate more with lower tau loads.
To check whether Aβ and tau are correlated within the same cortical region, Aβ deposit densities were Pearson correlated with the tau covered area of the same region (Fig. S16 and S17). With few exceptions, including the occipital cortex showing weak positive correlations for several Aβ deposit classes, the Aβ classes and local tau load were mostly not correlated. This finding suggests there may hardly be a direct, local connection between tau and Aβ.
To examine the association between Aβ deposit densities and Braak and Braak stages as a tau measure, we applied pairwise multiple linear regression models, correcting for ApoE genotype, age, sex and region names (Fig. 5c, Fig. S15). Plaque loads were comparable between Braak and Braak stages IV to VI with no significant differences after FDR correction. Before FDR correction, there was a trend towards increased densities of cored plaques in the Braak and Braak stage V group compared to IV (β=0.87, pwithout FDR=0.008, pFDR=0.05) and VI (β=−0.46, pwithout FDR=0.029, pFDR=0.11). Additionally, there was a trend towards increased loads of diffuse dense plaques in Braak and Braak stage VI (compared to IV: β=2.86, pwithout FDR=0.015, pFDR=0.07; compared to V: β=4.87, pwithout FDR=0.008, pFDR=0.05) and increased CAA densities in Braak stage VI compared to stage V (β=0.51, pwithout FDR=0.006, pFDR=0.05). Regarding proportional plaque loads, Braak and Braak stage VI was associated with increased proportions of diffuse dense plaques (compared to stage IV: β=2.3, pFDR=0.03) and decreased proportions of small dense plaques (compared to stage IV: β=−2.4, pFDR=0.03). These findings suggest a trend towards slightly higher Aβ deposit loads and a tendency towards higher proportions of diffuse dense plaques with higher Braak and Braak stages, while the cortical density of diffuse dense plaques was negatively correlated with the entorhinal tau load. Thus, high Braak and Braak stages should not be equated with high entorhinal tau load, pointing to a nuanced picture.
To test whether α-syn co-pathology distribution groups, namely α-syn negative, amygdala predominant, brainstem predominant, and disseminated cortical α-syn pathology vary in their cortical Aβ class loads, pairwise multiple linear regression models were applied, correcting for ApoE genotype, age, sex and region names (Fig. 5c, Fig. S15). Plaque loads were mostly comparable across all groups. After FDR correction for multiple testing, three group differences stayed significant: the density of diffuse dense (β=−9.0, p=0.017) and small dense plaques (β=−11.7, p=0.011) was smaller in cases with brainstem predominant α-syn co-pathology than in cases with amygdala predominance; the latter finding was also true for α-syn negative cases showing higher amounts of small dense plaques than the brainstem predominant α-syn positive group (β=−5.1, p=0.017). These findings suggest a deviation of dense Aβ deposition in the α-syn brainstem group. Regarding percentage loads, the proportion of small dense plaques was significantly smaller in cases with amygdala predominant α-syn than in α-syn negative cases (β=−4.9, p=0.042) or cortical α-syn positive cases (β=2.25, p=0.042). In general, we did not find a strong association between α-syn co-pathology and different Aβ plaque classes.
We compared AD cases with and without TDP43 co-pathology with multiple linear regression, correcting for region names, ApoE genotype, sex and age at death (Fig. 5e, Fig. S15). TDP43 deposition was examined in the hippocampus, amygdala and medulla oblongata where available. There were lower densities of CAA and small dense plaques in TDP43-positive cases, which stayed not significant after FDR correction. Comparing Aβ class proportions, there were increased rates of diffuse light plaques in TDP43-positive cases (β=11.0, p=0.001) and decreased rates of small dense plaques (β=−2.6, p=0.001) and CAA (β=−6.1, p<0.001). These findings suggest an association between diffuse light Aβ plaques and TDP43 deposits, possibly due to overlaps in impaired protein degradation and clearance pathways. Small dense plaques and CAA occurred proportionally more frequently in cases without TDP43 deposition.
Associations between Aβ deposits, sex, and genotypes
Correcting for age at death, ApoE genotype, and region names (Fig. 6a, Fig. S18) in multiple linear regression models, female cases presented with significantly higher absolute densities of diffuse light (β=−17.3, p<0.001), diffuse dense (β=−6.1, p<0.001), compact (β=−2.2, p=0.007), and small dense deposits (β=−6.1, p<0.001) but, surprisingly, equal counts of cored plaques and CAA. Since the differing absolute values shift the ratios, males showed significantly higher proportions of cored plaques (β=0.67, p=0.046) and lower proportions of diffuse dense plaques (β=−3.0, p=0.024). These findings indicate that females generally accumulate higher Aβ plaque loads, except for cored plaques, which do not show a sex tendency in this cohort of advanced AD cases.
To investigate the effect of the ApoE genotype on cortical Aβ deposit classes, the absolute and relative amounts of each deposit class were compared between ApoE genotypes (E2/E3, E3/E3, E3/E4, E4/E4) with pairwise multiple linear regression, correcting for age at death, sex, and region names (Fig. 6b, Fig. S18). There were significantly higher densities of diffuse dense and small dense plaques in cases with at least one E4 allele in comparison with cases without E4. The same trend, although not significant, was observed for compact and partly for diffuse light plaques. No difference was observed for cored plaques, statistically limited by a low density and methodological constraints. There was a non-significant trend of more CAA in cases with an E2 allele (E2/E3 vs. E3/E3: β=−0.40, pwithout FDR=0.06, pFDR=0.16). Comparing proportions of deposit counts across ApoE genotypes, cases with E2/E3 constellation showed higher proportions of diffuse light deposits (β=−8.3, p=0.018) and smaller proportions of small dense deposits (β=4.0, p=0.018) than AD cases with E3/E4 genotype. These results suggest that the ApoE genotype partly affects the Aβ plaque composition, towards more dense deposits in cases with an E4 allele.
To examine the effect of specific AD-related mutations on cortical Aβ plaque classes, cases with APP, PSEN1 or PSEN2 mutation as well as sporadic case were compared pairwise with multiple linear regression, correcting for ApoE genotype, sex and region names (Fig. 6c, Fig. S18). In this analysis, sporadic cases were defined as AD with a reported age of onset >65 years and an inconspicuous whole-genome sequencing for AD-related variants. After FDR correction for multiple testing, there remained only one significant difference with PSEN1 mutation carriers having absolutely more cored plaques than sporadic AD cases (β=−0.48, p=0.019). Without FDR correction, cases with PSEN2 mutation showed slightly higher diffuse light deposit counts than sporadic cases (β=−24.8, pwithout FDR=0.005, pFDR=0.10), more diffuse dense plaques than PSEN1 mutation carriers (β=7.8, pwithout FDR=0.046, pFDR=0.25), more compact plaques than PSEN1 mutation carriers (β=4.28, pwithout FDR=0.045, pFDR=0.25), and more small dense plaques than PSEN1 mutation carriers (β=10.7, pwithout FDR=0.031, pFDR=0.25), however, with a limited number of only three PSEN2 carriers. In summary, the findings suggest that a PSEN1 mutation is associated with more cored Aβ plaques. Conclusions regarding PSEN2 are not reasonable due to the small number of cases.
Associations between Aβ deposits, age at disease onset, disease duration and age at death
Comparing the plaque densities between three groups of age at clinical onset (< 65 years, 65–74 years and ≥75 years) (Fig. 7a, Fig. S19) with multiple linear regression, correcting for ApoE genotype, sex and region name, the oldest group with onset ≥75 years tended to have fewer cored plaques than the middle group (65–74 years) (β=−0.68, pwithout FDR=0.014, pFDR=0.25) and fewer diffuse dense plaques than the youngest group (< 65 years) (β=−2.46, pwithout FDR=0.032, pFDR=0.25). Regarding proportional Aβ deposit loads, the youngest group (< 65 years) showed significantly higher loads of diffuse light plaques than the middle-aged group (65–74 years) (β=−7.4, p=0.013) and fewer small dense plaques than the middle aged (β=5.9, p<0.001) and the oldest group (≥ 75 years) (β=3.3, p<0.001). These findings suggest that cored plaques and a higher amount of diffuse light plaques are associated with younger age at onset, keeping in mind that familial AD cases are included in the cohort.
To estimate the association between disease duration and cortical Aβ deposition, the absolute and relative amounts of each deposit class were compared between four groups (< 5 years, 5–9 years, 10–14 years, ≥15 years). The multiple linear regression models were corrected for age at death, sex, ApoE genotype, and region names (Fig. 7b, Fig. S19). A longer disease duration (≥ 15 years) was associated with higher absolute counts of diffuse light plaques than a duration of 5–9 years (β=6.4, p=0.040). A longer duration of 10–14 years was associated with higher diffuse dense plaque counts than <5 years (β=5.2, p=0.026). The results suggest an accumulation of diffuse plaques over time with dementia. Cored plaques, CAA, Compact and small dense plaques were comparable between disease duration groups. Comparing the class proportions, a short disease duration (< 5 years) was significantly associated with a higher proportion of cored plaques than in cases with long disease duration (≥ 15 years) (β=−0.57, p=0.016) and CAA compared to 5–9 years disease duration (β=−1.21, p=0.039) and ≥15 years disease duration (β=−0.62, p=0.016). While the proportions of diffuse light and diffuse dense deposits were mainly increasing with longer disease durations, the proportions of compact and small dense plaques tended to decrease with longer disease durations. Although the estimation of disease duration is partly subjective, the findings suggest that diffuse light and diffuse dense plaques can accumulate over time to a considerable extent without having an immediately life-limiting effect. In contrast, cases with short disease durations show equal amounts of cored plaques and CAA, which, therefore, might be crucial for clinical disease progression.
To assess the relationship between age at death and Aβ plaque loads, the absolute and relative amounts of each deposit class were compared between three age groups (< 65 years, 65–74 years, ≥75 years) with multiple linear regression across cortical regions, correcting for sex, ApoE genotype, and region names (Fig. 7c, Fig. S19). It is noticeable that a young age at death (< 65 years) was significantly associated with higher absolute amounts of cored plaques compared to the middle-aged group 65–74 years (β=−0.88, p=0.0025) and to the aged group ≥75 years (β=−0.34, p=0.019). Furthermore, <65 years patients had higher loads of diffuse light deposits than ≥75 years patients (β=− 11.6, p<0.001). Regarding small dense plaques, the middle group (65–74 years) showed lower densities than the younger group (< 65 years) (β=−5.4, p=0.043) and the older group (≥ 75 years) (β=6.0, p=0.005). On a proportional level, the oldest group (≥ 75 years) showed a significantly lower proportion of diffuse light plaques than 65–74 years old patients (β=−7.0, p=0.027) and increased rates of small dense plaques compared to <65 years (β=2.7, p=0.003) and 65–74 years groups (β=6.8, p<0.001). Together, these findings indicate that patients dying younger bear higher loads of cored and diffuse light Aβ plaques before death, which might be partly explained by familial AD cases in the cohort.
Integration of Aβ deposit determinants
Finally, sex, ApoE, age at onset and disease duration were integrated into linear mixed-effects models across cortical brain regions, correcting for the brain region and a random factor for individual subjects (Fig. 8). Excluding data points with incomplete metadata, 461 observations per deposit class from 64 patients were included in this analysis. There was a significant association between female sex and increased densities of diffuse light plaques (coefficient β=−15, p=0.048). An association between the ApoE4 allele and diffuse dense plaques was detected, but did not survive FDR correction (β=5.4, pwithout FDR=0.040, p=0.10). A lower age at onset, also indicating familial AD cases, was significantly associated with higher densities of cored plaques (β=−0.02, p=0.048), diffuse light plaques (β=−1.2, p<0.001), and CAA (β=−0.01, pwithout FDR=0.041, p=0.10), while the latter did not remain significant after FDR correction. A shorter disease duration was associated with higher CAA densities, which also did not survive FDR correction (β=−0.02, pwithout FDR=0.037, p=0.10).
Repeating this analysis with multiple linear regression models in individual brain regions, e.g., middle frontal gyrus, occipital gyrus and sulcus, the results were partially replicated, while other correlations differed (Fig. S20). An association repeatedly emerged between younger age at onset and higher densities of cored and diffuse light plaques, as well as between female sex and increased diffuse light plaque loads, whereas a relationship between disease duration and CAA was not observed in the exemplary regions. According to R2 and adjusted R2 values, indicating how well the models predict the variance of the dependent variable, the factors sex, ApoE, age at onset and disease duration hardly explain the densities of compact plaques or CAA (R2adj ≤ 7%), weakly explain the density of cored plaques (R2adj up to 13%), and partly explain the densities of diffuse light (R2adj up to 37%), diffuse dense (R2adj up to 19%) and small dense plaques (R2adj up to 36%) with the highest scores in the occipital sulcus.
Discussion
Detecting Aβ deposits in 84 cases of Alzheimer’s disease (AD), we successfully distinguished six different deposit classes with a convolutional neural network. A high and intercorrelated Aβ load was observed in cortical regions compared to lower loads in subcortical areas. Diffuse light and small dense plaques dominated in terms of numbers. The relationships between deposits, associated factors and determinants are complex and not uniform across the different types of deposits and brain regions.
Aβ deposit classification
Based on manual classification of 3139 Aβ deposits, a convolutional neural network was trained, optimized and tested to distinguish six deposit classes, reaching an overall recall of 81.5% and a precision of 82.4% in the test set. Subsequent visual control of cored plaques and CAA prediction ensured no false positives in these two groups which have a tendency towards reduced precision due to the low count compared to the other classes. Distinct cotton-wool plaques [45] and coarse-grained plaques [9, 10] were too rare for a stable prediction and were pooled in the compact plaque class.
Our convolutional neural network architecture was an extension of the model by Tang et al. [71], which classifies Aβ deposits into diffuse, cored plaques and CAA with a very high accuracy/recall of 0.987. It should be noted that the test set in Tang et al. [71] was unbalanced towards diffuse plaques and the model can, therefore, achieve a very high general accuracy. Besides the addition of a convolutional layer and larger, grayscale images as input, the main improvement is that our newly trained model distinguishes more classes and can thereby better reflect reality, capturing numerous deposits that do not explicitly fall into cored or diffuse plaques and also smaller deposits that were more generously excluded in Tang et al. [71]. Another model, e.g. the model by Wong et al. [89], shows a comparable performance to our model, but is limited to cored plaques and CAA. The model by Amin et al. [3] performed highly, but is also restricted to three deposit classes and not realistic for our study approach. Thus, the performance of our model is lower or comparable to models in the literature, but improved by partial visual controls and tailored to the specific dataset and research question, covering a wide range of Aβ deposits and thus being closer to reality.
Aβ deposition across brain regions
Aβ plaques were quantified in advanced AD cases stained with the antibody clone 4G8 across brain regions. The Aβ loads were highest in the frontal, parietal, temporal and insula cortex and lower in the occipital, parahippocampal and entorhinal cortex, subcortical, hippocampal and cerebellar regions. The findings align with the literature and follow the Thal stages, progressing from high amounts in the neocortex to the later and less affected allocortex and hippocampus and finally the cerebellum [73].
Interestingly, the regions that are commonly affected regarding intracellular tau, α-syn and TDP43 pathology, such as the amygdala, hippocampus, and entorhinal cortex, are less affected by Aβ. Projection neurons affected by tau pathology, being associated with Aβ deposition in the targeted cortical regions via Aβ release from terminal axon segments, might explain a part of this pathology distribution [13, 14]. The released Aβ peptides can diffuse into the extracellular space [13] and accumulate into oligomers and larger aggregates later on [38]. This theory is supported by the fact that there were hardly any correlations between tau and Aβ within the same brain region. A targeted correlation analysis regarding connected brain regions, especially the brainstem-cortical axis, is needed to pursue this theory further.
A focus on connections would also be interesting in terms of the positive correlations of the plaque loads within cortical regions, within hippocampal regions, and between cortical and hippocampal regions. However, connectivity alone does not explain the extent of Aβ accumulation; for instance, claustrum and thalamus are diffusely connected regions, but exhibit only medium plaque loads.
Across regions, diffuse plaques dominated the scene. Fleecy diffuse plaques are known to appear in early stages [74]. Although at low percentages, there are trends towards more compact and cored plaques in cortical regions. This could be due to a developmental course from diffuse to ‘mature’ plaques in more and earlier affected cortical regions or because of regional factors that increase the Aβ load and the probability for these more defined plaque types to occur [72]. The density of cored plaques did not correlate with the overall Aβ plaque density in the same region, which points to a separate mechanism of origin for cored plaques.
In the following paragraphs, we will firstly discuss the most outstanding findings for each Aβ plaque class, including individually associated factors. Afterwards, the probable determinants are discussed in a synopsis.
Cored plaques
Cored plaques were defined as Aβ plaques with a dense core with a free ring and a denser rim. Compared to other deposits, their density was relatively low. The true number of cored plaques was probably underestimated as the core is sometimes not visible depending on the sectional plane. In previous studies, the observed density of cored plaques was described as higher, with around 20% of the Aβ plaques in advanced AD [25], but it is mostly in line with the counts of neuritic senile plaques in Delaère et al. [20]. In the manually annotated Aβ plaque set in Tang et al. [71], the number of cored plaques compared to dominating diffuse plaques was also low with 2.2% of annotated images, pointing in our direction. Furthermore, we included many small dense plaques in our analyses, which are commonly excluded in other studies, further reducing the proportion of cored plaques. In our study, the proportional load of cored plaques decreased in cases with generally higher Aβ loads, questioning the simplicity of a proposed linear development from diffuse to compact to cored plaques.
It is striking that the cored plaque density remained stable across most of the cohort of advanced AD cases, independently of sex and ApoE genotype. The effect of ApoE4 on cored plaques is inconsistent in the literature [7, 17, 59] and is also biased by a cohort of advanced AD cases in our study. There were higher densities of cored plaques in people with a younger age at death and patients with a PSEN1 mutation. Although not significant in every study [90], there is a trend towards higher Aβ loads, especially Aβ42, in familial and early onset AD cases in the literature [29, 42, 51].
Interestingly, cored plaques were the only plaque class showing a positive correlation with the entorhinal tau load. A large proportion of cored plaques are also neuritic plaques [22, 25], which are associated with activated microglia and reactive astrocytes [22]. Especially cored, neuritic plaques, tau and synaptic and neuron loss are correlated with cognitive decline [7, 23, 50, 64, 66]. In summary, cored plaques could be more clinically relevant than other plaque types despite the comparably low density.
Diffuse light plaques
Diffuse light plaques, defined as mostly low-intensity Aβ, represent the largest group of plaques across most of the brain regions. They occur early in the disease [56], mainly consist of Aβ42 and usually lack fibrils [37, 92]. In our study, diffuse light plaques showed low positive correlations with diffuse dense and small dense plaques and were slightly negatively correlated with the density of compact plaques. Hypothetical explanations could be that, with enough diffuse light plaques, some large diffuse light plaques will develop to diffuse dense plaques by continuous Aβ production and some small diffuse light plaques might develop to small dense plaques [49, 82, 93], probably accompanied by a shift from Aβ42 to Aβ40 [54, 55]. Apart from that, mouse experiments suggested distinct mechanisms showing diffuse plaque accumulation does not unconditionally increase compact plaque load [48]. It is, therefore, also conceivable that diffuse light plaques resolve and denser and compact deposits form by different mechanisms, instead of a direct transition from one form to the other.
The density of diffuse light plaques was negatively correlated with the entorhinal tau load. This finding is in line with previous studies showing that diffuse Aβ plaques do not correlate with synapse loss or functional scores [50, 52] and were less or not associated with neuritic components or microglia [25, 36, 91].
Diffuse dense plaques
With increasing deposit loads, the proportion of diffuse dense plaques, here defined as diffuse plaques with dense, irregular centers and indistinct edges, increased in cortical regions. Thereby, the density of diffuse dense plaques correlated positively with compact and small dense plaques and weakly with diffuse light plaques. There was a higher cortical density of diffuse dense plaques in female cases and in ApoE4 carriers.
Transitional Aβ plaque forms between specified plaques are hardly discussed in the literature, which makes it difficult to interpret these findings. However, a spectrum of fine diffuse and dense diffuse plaques as well as the appearance of amyloid fibrils in denser parts of some diffuse plaques were described before [49, 92]. In our analyses, two results stand out: Firstly, with increasing total Aβ plaque load, the proportional share of diffuse dense plaques is the only one that shows a discernible increase. Thus, either a high Aβ plaque density might lead to denser cores in diffuse plaques or confounders, causing generally high Aβ loads, also promote diffuse dense plaque accumulation. Secondly, ApoE4 was repetitively associated with higher densities of diffuse dense plaques in different statistical models, suggesting that ApoE4 contributes to the compactness of Aβ plaques. This result is in line with a study in mice showing more dense plaque morphologies in ApoE4 carriers [61]. The exact mechanisms of ApoE4 increasing the AD risk and the Aβ load are still under discussion; an enhanced aggregation and an adverse effect on the Aβ clearance are assumed [46].
Compact plaques
Compact plaques, having a mostly sharp border and often oval or round shape, included subtypes, such as cotton-wool plaques and coarse-grained plaques. We refrained from differentiating these subclasses to avoid making the classes too small, and thereby further reducing the performance of the classifier. Despite the name compact, a porous structure is common due to constant aggregation and resolution in the plaque [18]. The density of compact plaques correlated positively with diffuse dense and small dense plaques, suggesting a relationship and possibly a transition between diffuse dense, small dense and compact plaques. On the other hand, there was a negative correlation with diffuse light plaques, indicating some conditions in AD cases might lead towards more compact plaques, such as CLAC (collagenous Alzheimer amyloid plaque component), suggested by Hashimoto et al. [33] or more diffuse plaques via different pathways [48].
Cerebral amyloid angiopathy
Cerebral amyloid angiopathy (CAA) of the Aβ type is here defined as Aβ deposition in leptomeningeal or intraparenchymal blood vessel walls, mostly small arteries and less often capillaries. CAA was slightly pronounced in the frontal sulcus and especially in the occipital cortex, in line with the literature [77, 79].
We neither found a correlation between CAA and the overall Aβ plaque load across cortical regions nor between CAA and other Aβ plaque classes. Thus, a statistical correlation between CAA and dense Aβ depositions, as suggested by Kumar-Singh [41], was not proven in our dataset. We found a comparable CAA density in female and male patients and, thereby, were also unable to confirm a higher CAA load in male cases that has been described before [68]. These divergent results could be attributed to the relatively small annotated brain regions in our study, whereby low-density deposits are not always represented in a characterizable manner. Before correction for multiple testing, there were higher CAA densities in AD cases with earlier age at onset and shorter disease duration, in agreement with former findings [76].
In previous literature, ApoE4 was described as a risk factor for CAA, while ApoE2 was associated with CAA in larger arteries [68, 73]. Although we did not find a significant difference in our cohort regarding the ApoE status, there was a non-significant trend towards higher CAA density in ApoE2 carriers vs. E3 homozygous patients. Whether a higher density of CAA suggests an overloaded perivascular clearance [8, 41] and if it is independently associated with cognitive decline [11] cannot be further verified based on the data obtained.
Small dense plaques
Small dense plaques were defined as small (but larger than 100 µm2), mostly compact Aβ accumulations. Similarly to diffuse dense plaques, this class is not explicitly defined in the literature, but was considered necessary for this analysis to accommodate the variability in the cases. A proportion of the detected small dense plaques probably corresponds to cores of cored plaques and burned-out plaques [41, 82] although there was no positive correlation between small dense plaques and cored plaques. Another portion likely corresponds to larger accumulations of intracellular deposits [19]. Some will be nonspecific, condensed extracellular deposits, which may have arisen from previously small, diffuse light or diffuse dense deposits or will develop towards diffuse dense or compact plaques. It is conceivable that some of these deposits are in the process of growing or disappearing [15, 70, 94], however, the proportions are unclear.
The density of small dense plaques correlated positively with the total Aβ plaque load and with the densities of diffuse dense, compact, and weaker with diffuse light plaques, suggesting developmental overlaps between these classes. Following previous observations [65], there was no trend from small dense plaques to larger (diffuse dense or compact plaques) across the spectrum of less to severely affected regions or across disease durations. The ApoE4 genotype was associated with more small dense plaques, in line with a higher condensation observed in E4 allele carriers as discussed for diffuse dense plaques [61].
Integration of Aβ deposit determinants
Sex, ApoE, age at onset and disease duration were integrated in a statistical model to predict plaque densities in cortical regions. We found complex, often weak and partly region dependent relationships between these factors and individual Aβ plaque classes. Among the stronger effects were a positive correlation between female sex and a higher density of diffuse light plaques. Furthermore, younger age at clinical disease onset, partly due to familial AD cases, was associated with higher densities of cored and diffuse light plaques. Although not significant after FDR correction, there was a trend towards more diffuse dense and small dense plaques in ApoE4 carriers.
The results suggest that risk and clinical factors are not uniformly associated with all forms of Aβ deposits, but rather correlate with specific deposit classes in specific regions, e.g., ApoE4 with denser deposits and young age at onset with cored plaques. The exact results vary depending on the co-factors in statistical models, which points to often weak effects and interdependencies between factors. Interactions between different factors were not explicitly addressed in our simplified model. However, in the literature, there are indications that age, sex and ApoE status have different effects in different combinations [28, 84] and confound the disease duration [75]. These factors were also associated with different ratios of soluble and fibrillar Aβ in non-demented people at varying degrees across brain regions [16].
In summary, relationships appear complex and result in distinct compositions within individual brains. This study may serve as groundwork for cross-regional imaging and molecular analyses by providing a metadata-differentiated dataset for further correlative analyses (Table S18, S19). However, a significant portion of the plaque density variability remains unexplained by the factors investigated in this study, suggesting that further determinants, such as lifestyle elements and co-morbidities, may also play a role.
Limitations and further questions
This study is an approach to investigate determinants and associated factors of Aβ deposition in a large AD cohort across brain regions. Numerous Aβ deposits were automatically detected and classified into six deposit classes. Observations were correlated with co-pathology, genetic and clinical data, providing a comprehensive overview.
An important limitation of this project is the bias in the dataset, based on voluntary brain donation in a Western country. This leads to a missing ethnic diversity and an overrepresentation of familial AD cases. The effect of AD-related mutations on the Aβ plaque composition was analyzed separately to estimate the impact. Second, there is an unbalanced sampling of areas between subjects which might introduce a bias in the downstream analyses. Control analyses in a complete data subset excluded big distortional effects, but a bias in individual analyses is still conceivable. Third, the annotated rectangles in each region are relatively small, bearing the risk that these are not representative of the whole region. This applies in particular to deposits with low densities, i.e., CAA and partly cored plaques, or regions with low Aβ loads. Statements regarding CAA density are, therefore, made with caution in this analysis. Fourth, the plaque classifier is robust in many examples, but partly shows limited performance. The wide range of morphologies, which often cannot be unambiguously classified even by humans, further complicates the process. Moreover, a portion of the plaques was likely not sectioned representatively, e.g., the number of cored plaques is likely underestimated as the core is sometimes not visible depending on the sectional plane. Fifth, Aβ oligomers are not reflected in this study and small plaques (< 100 µm2) were also removed during preprocessing. Consequently, presumably clinically relevant deposits are missing in the downstream analysis and need clarification in further studies. Sixth, this study only covers a fraction of the factors that are directly or indirectly associated with Aβ deposition. Numerous components, such as lifestyle, education, secondary diagnoses, and blood vessel pathology, as well as details about the clinical presentation, are missing in this analysis. Finally, causal conclusions remain speculative due to the correlative, post-mortem attempt.
Conclusion
Quantifying and classifying Aβ deposits in histological stains of Alzheimer’s disease cases, we found cortically dominated and, to a large extent, diffusely undifferentiated Aβ plaques. Only cored plaques were positively correlated with the entorhinal tau load. Female sex was associated with higher densities of diffuse plaques and ApoE4 genotype with denser plaque types. Earlier age at onset and death were associated with higher densities of diffuse light plaques. The effect sizes depended on the region and convergence of determinants. Compared to diffuse, small and compact plaques, cored plaques and CAA stand out statistically despite a relatively low density, suggesting special roles in the course of Alzheimer’s disease.